Paper products
Industry profile, February 2020
Sections: Description | Pricing | Costs | Demand | Appendix
This page is an industry profile for the Paper products industry. It provides a general economic overview of recent developments in the industry. This includes information on industry pricing, costs, and demand. Below you will find a description of what type of business establishments are included in this industry. For information on how to best utilize this industry profile please visit our Business Solutions.
Industry Description
Industries in the Paper Manufacturing subsector make pulp, paper, or converted paper products. The manufacturing of these products is grouped together because they constitute a series of vertically connected processes. More than one is often carried out in a single establishment. There are essentially three activities. The manufacturing of pulp involves separating the cellulose fibers from other impurities in wood or used paper. The manufacturing of paper involves matting these fibers into a sheet. The manufacturing of converted paper products involves converting paper and other materials by various cutting and shaping techniques and includes coating and laminating activities.
This industry description was sourced from the North American Industry Classification System.
To download this data, or to learn more about how pricing is measured, please contact us.
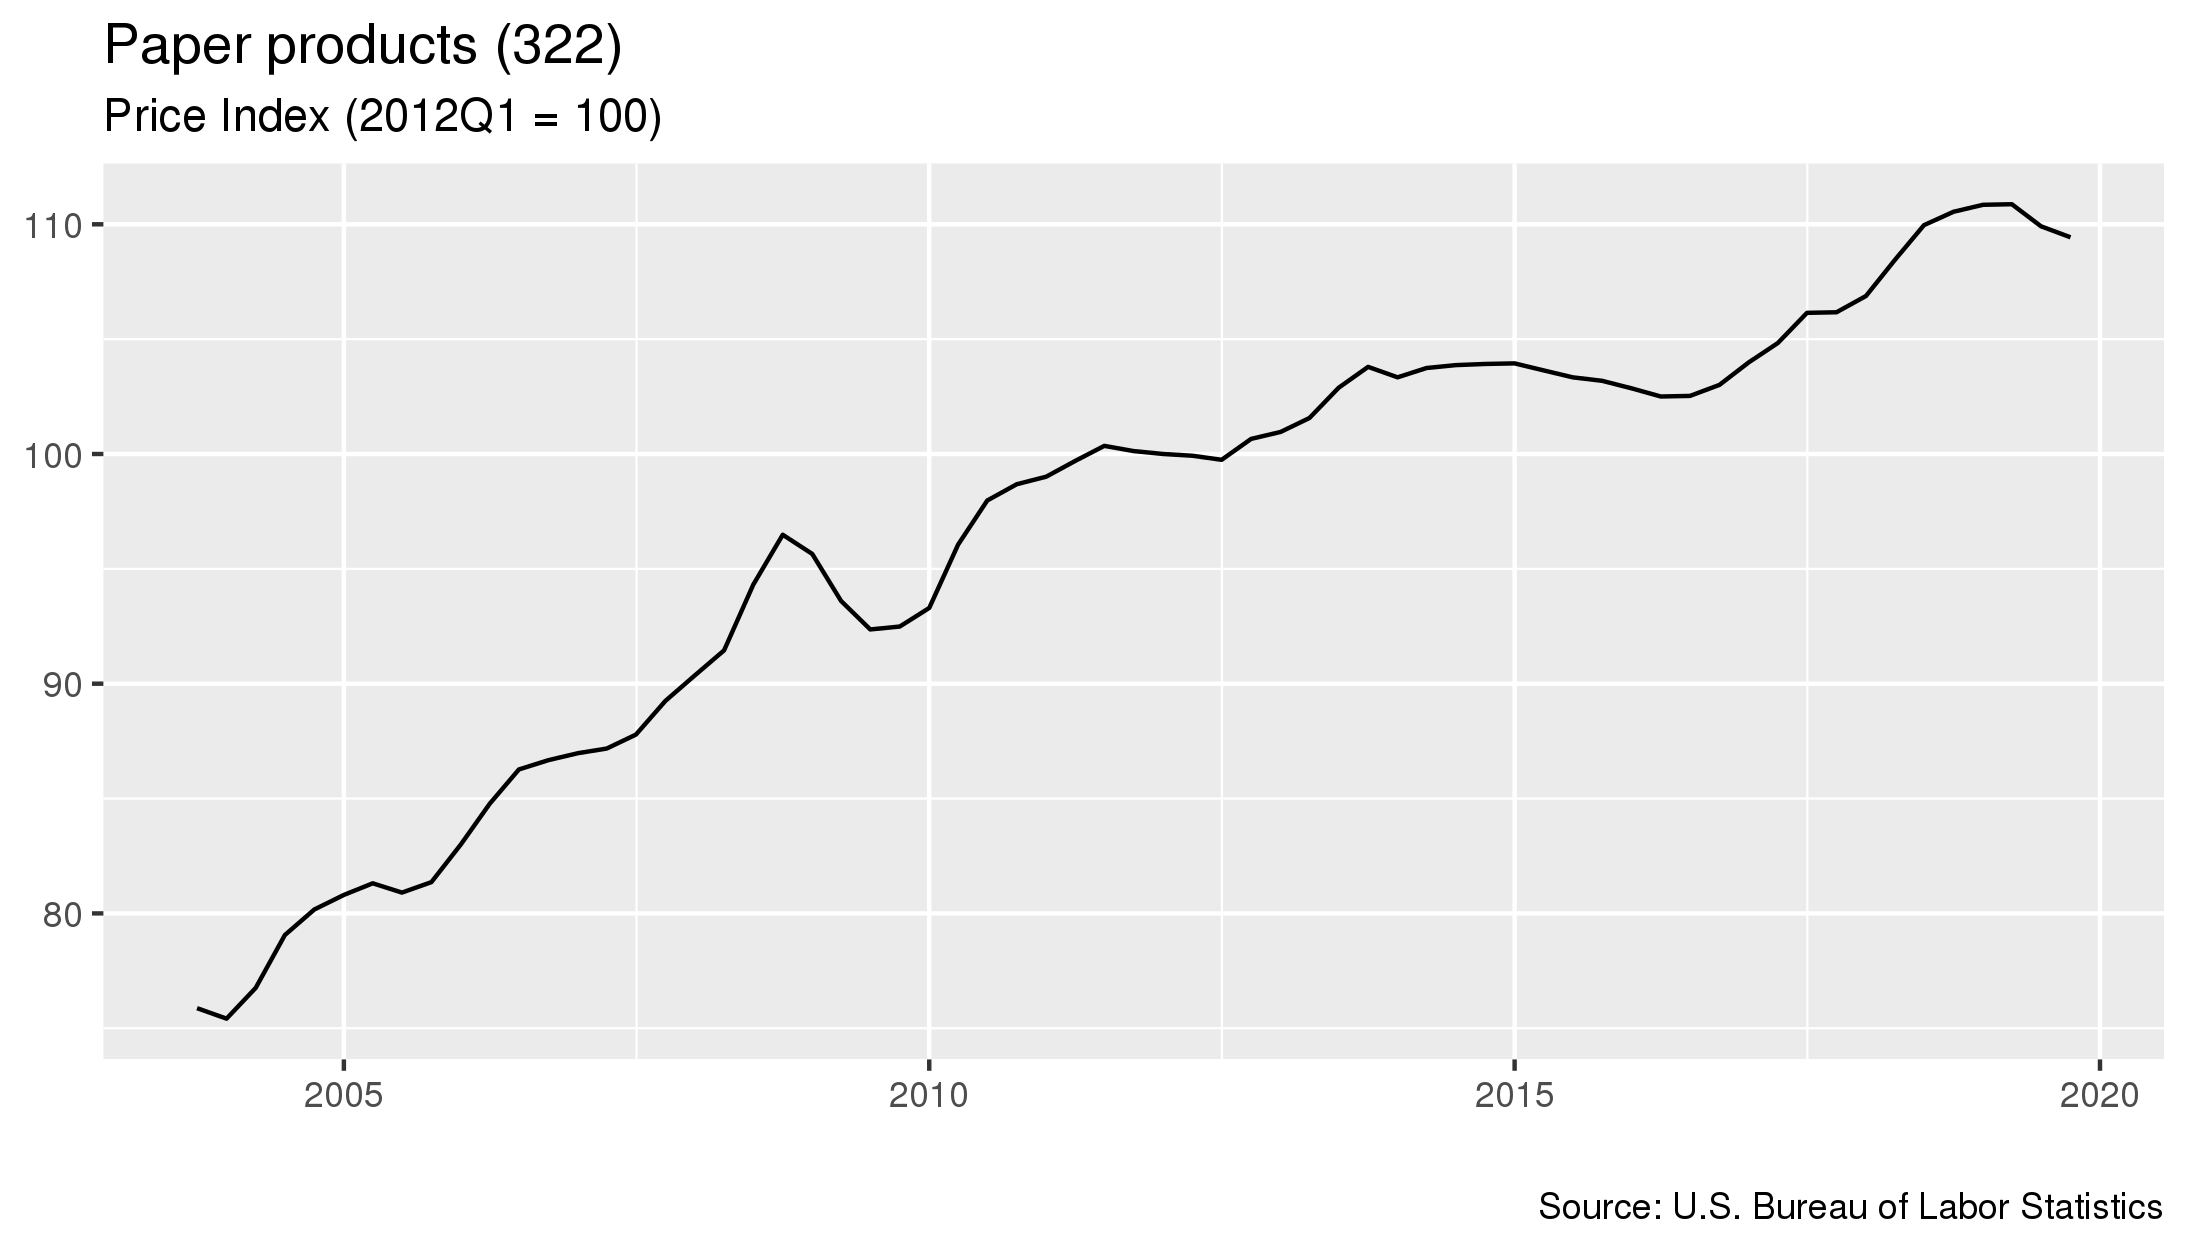
- As of January 2020, prices in this industry had decreased 0.4 percent since the previous quarter.
- From January 2019 to January 2020 prices in this industry decreased 1 percent.
- Prices increased 6.1 percent in the five year period starting in January 2015 and ending in January 2020.
To download this data, or to learn more about how costs for this industry are measured, please contact us.
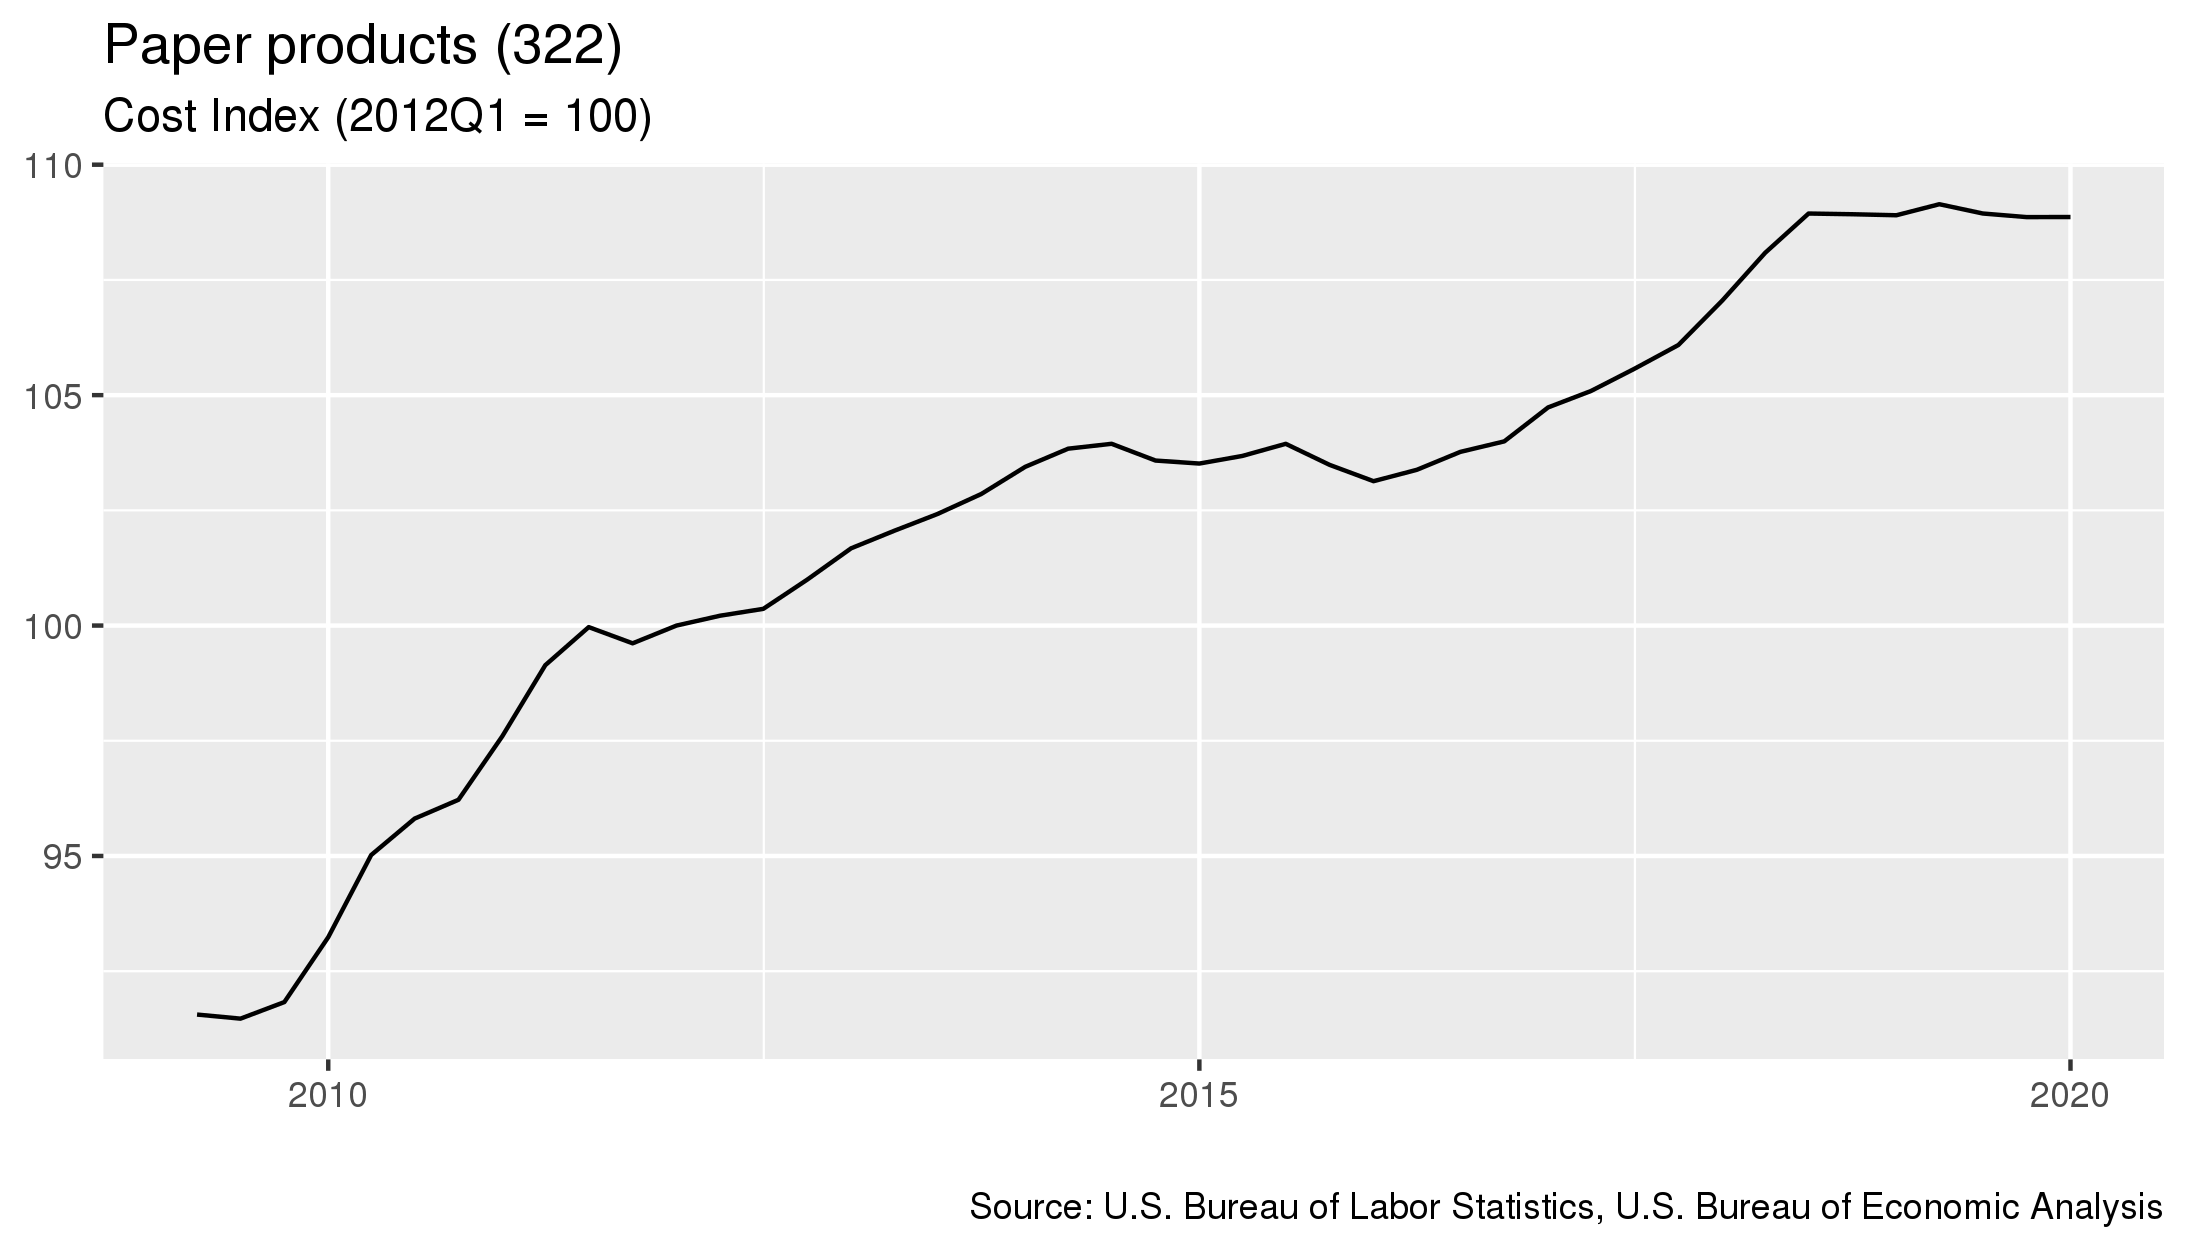
- As of January 2020, costs in this industry had increased 0 percent since the previous quarter.
- From January 2019 to January 2020 costs in this industry 0 percent.
- Costs increased 5.6 percent in the five year period starting in January 2015 and ending in January 2020.
For details on which industries are included in each sector, click here
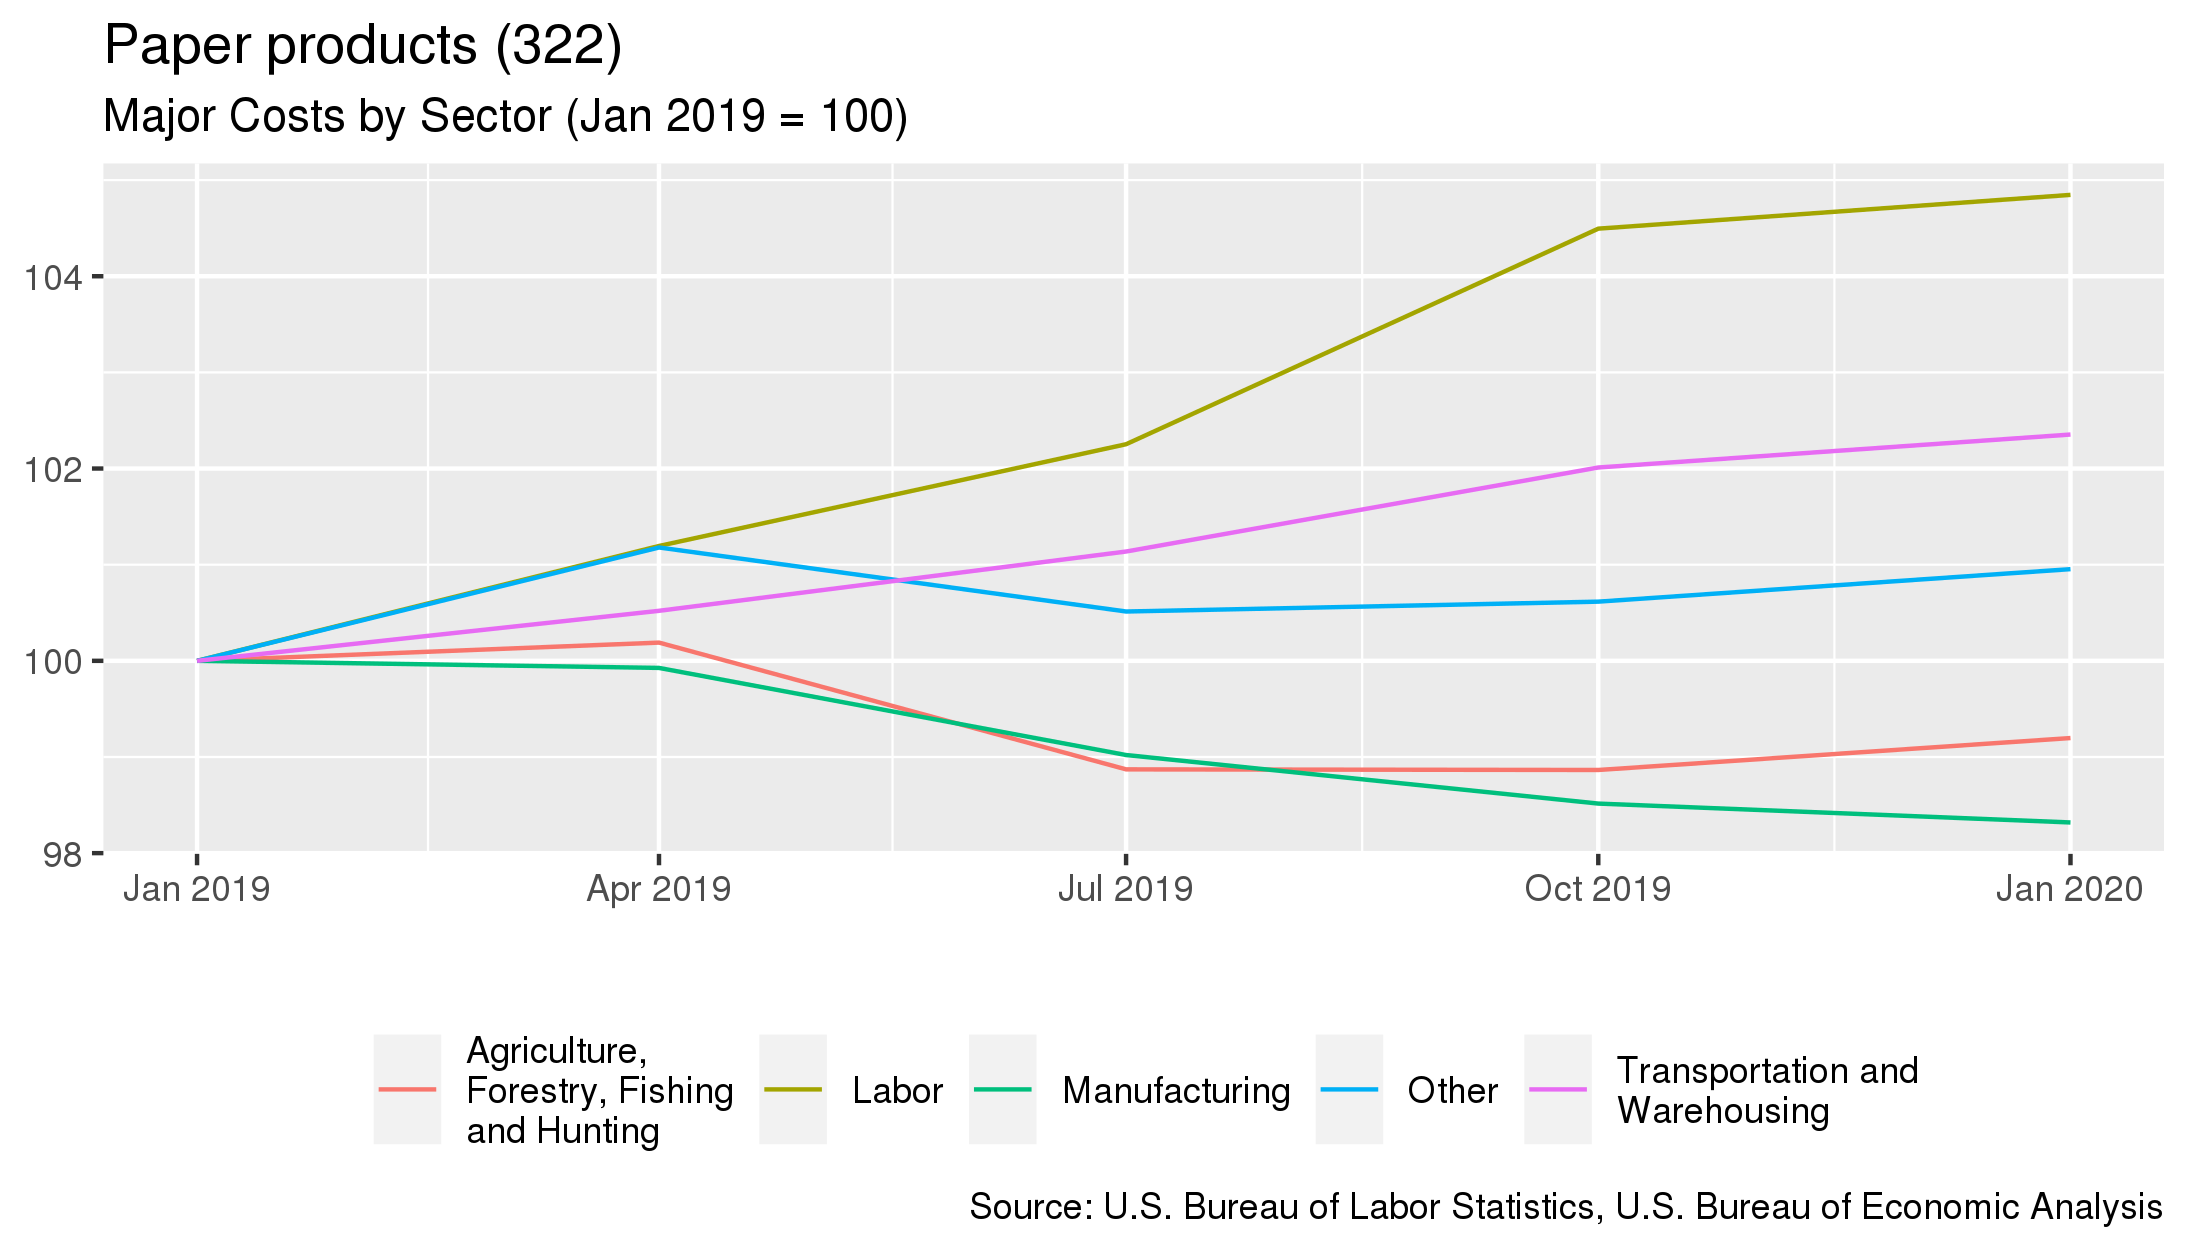
- The largest cost for this industry is purchases made to the Manufacturing sector. This sector accounts for 55.4% of the industry's overall costs.
- From January 2019 to January 2020, the largest change in costs for this industry were costs associated with purchases to the Labor sector. Costs associated with this sector increased 4.8%.
| Sector Name | Percentage of Costs | Annual Percent Change 4 |
|---|---|---|
| Manufacturing | 55.4% | -1.7% |
| Labor | 19.8% | +4.8% |
| Agriculture, Forestry, Fishing and Hunting | 4.2% | -0.8% |
| Transportation and Warehousing | 3% | +2.4% |
| Other | 2.9% | +1% |
To download this data, or to learn more about how demand for this industry is measured, please contact us.
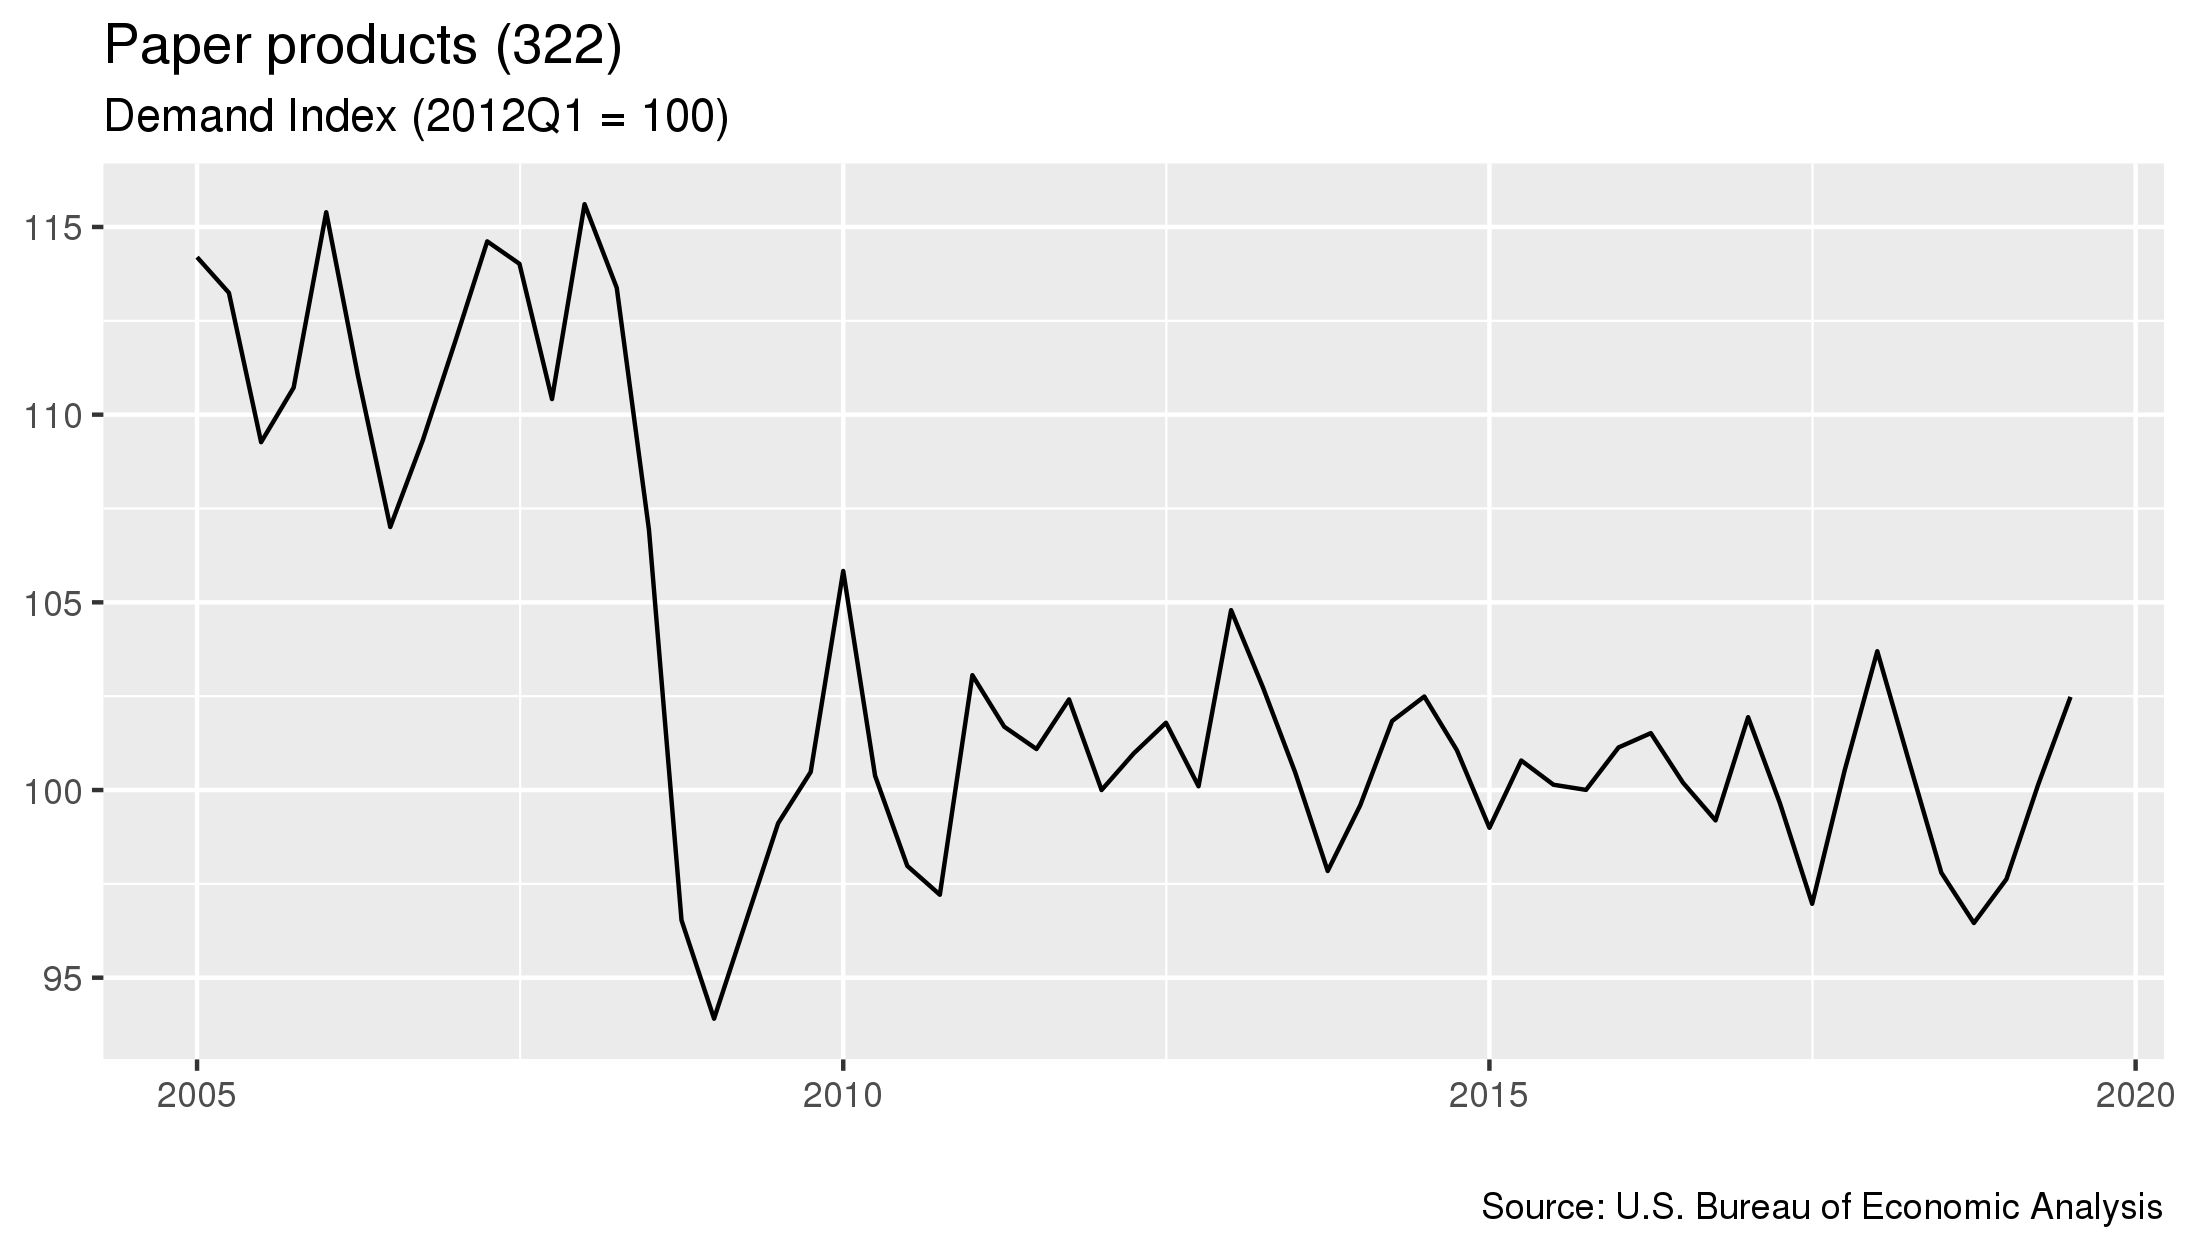
- As of July 2019, demand for this industry had increased 2.3 percent since the previous quarter.
- From July 2018 to January 2020 costs in this industry increased 4.8 percent.
- Costs increased 2.3 percent in the five year period starting in July 2014 and ending in July 2019.
For details on which industries are included in each sector, click here
- The sector that contributes the most to this industry's demand is the Manufacturing sector. This sector accounts for 42.2% of the industry's overall demand.
- From January 2019 to January 2020, the largest change in demand for this industry was from the Exports sector, where demand increased 44.3%.
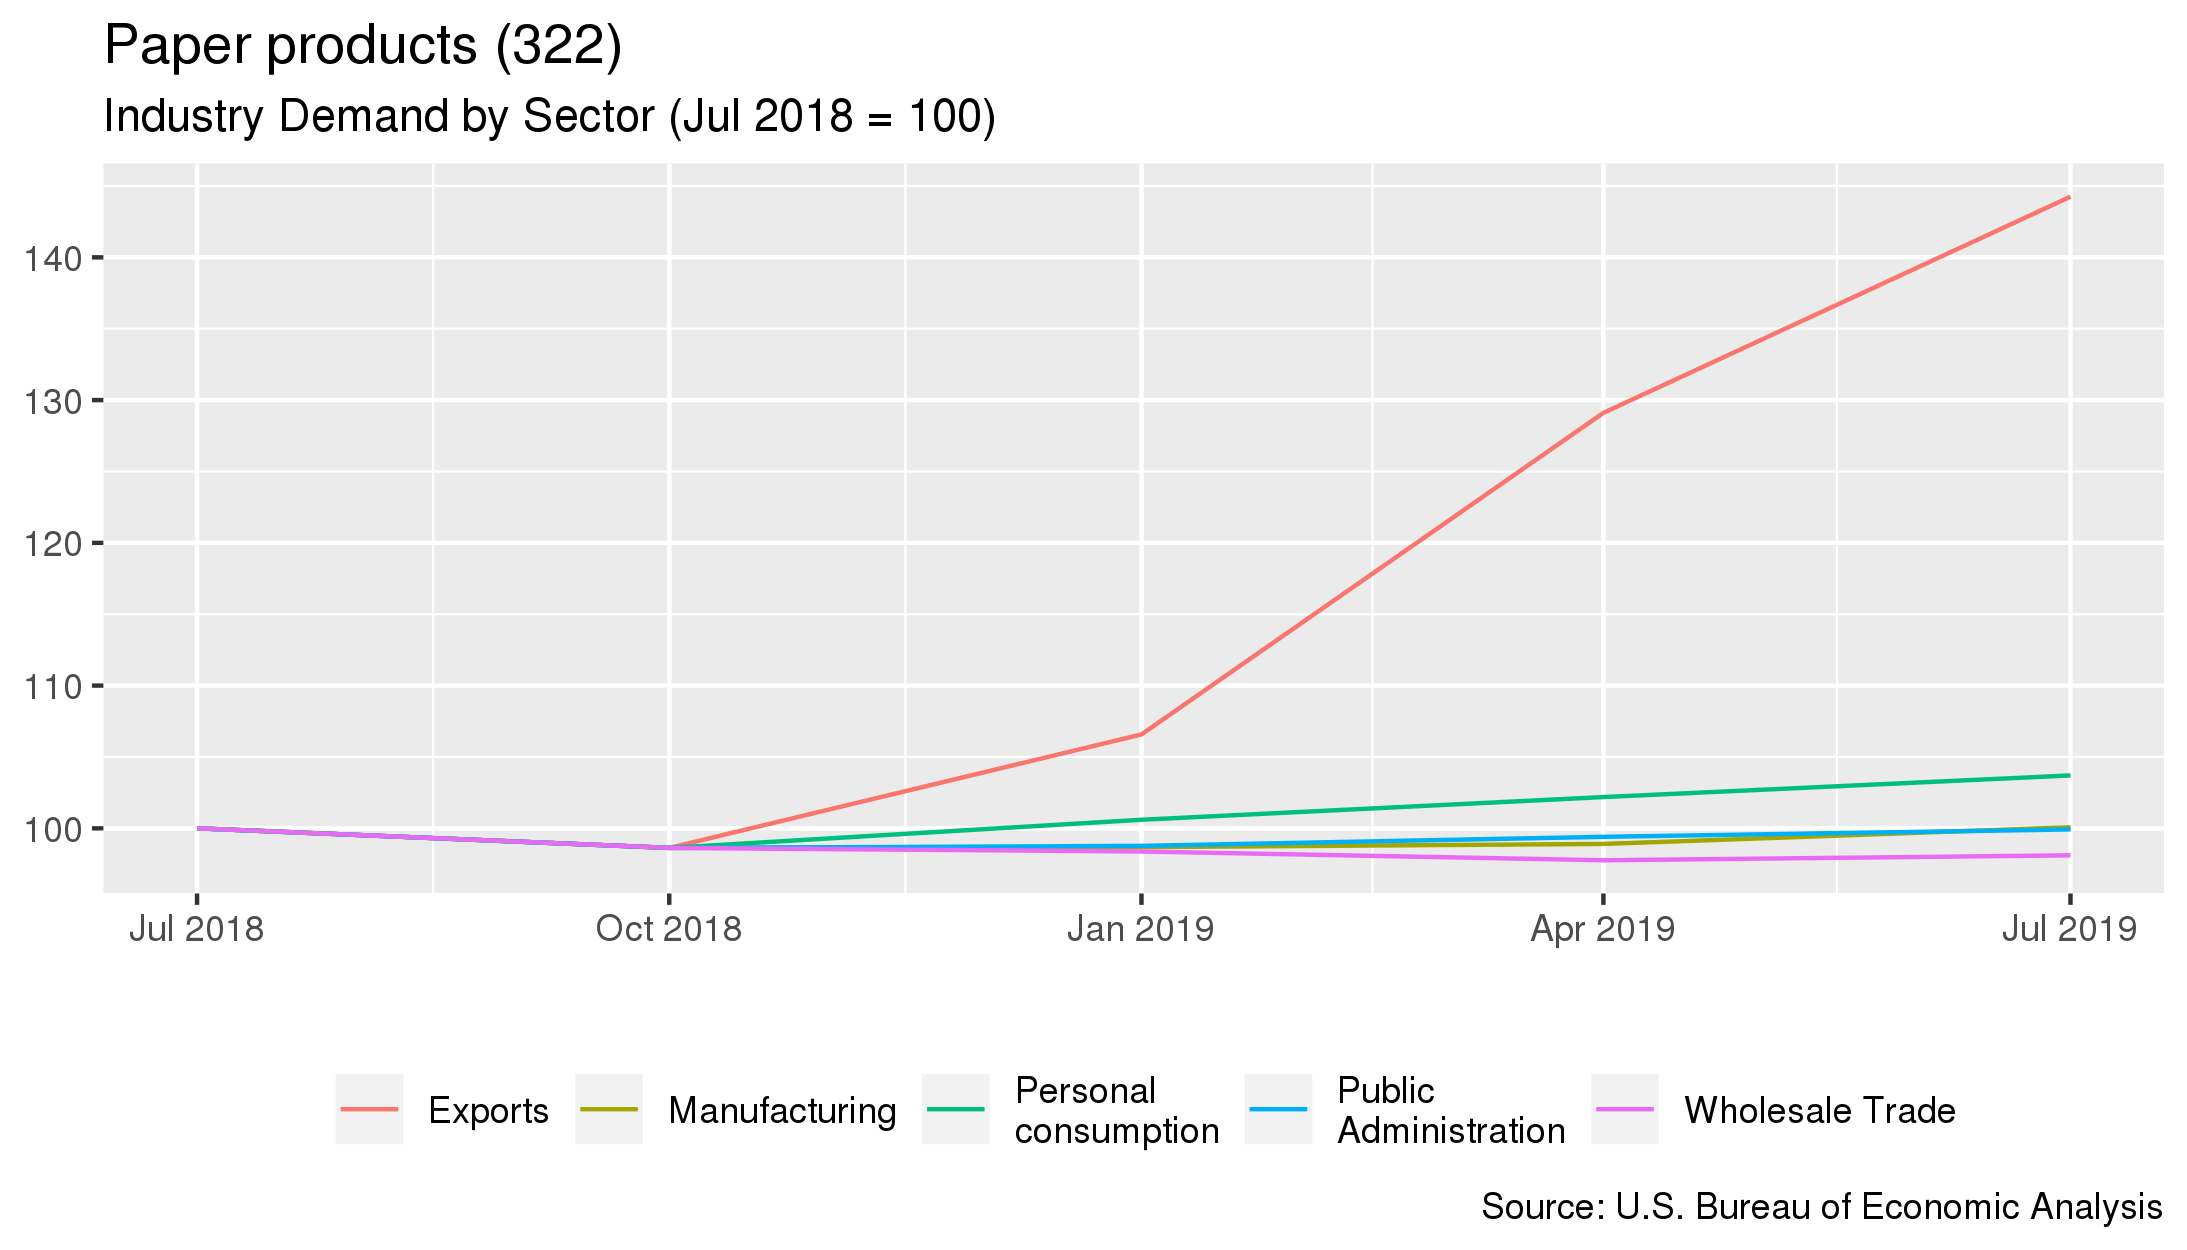
| Sector Name | Percentage of Demand | Annual Percent Change 6 |
|---|---|---|
| Manufacturing | 42.2% | +0.1% |
| Personal consumption | 16.9% | +3.7% |
| Exports | 13% | +44.3% |
| Public Administration | 6.3% | -0.1% |
| Wholesale Trade | 5.1% | -1.9% |
- Pricing measured from January 2020.
- The BLS PPI used for this industry is PCU322---322---.
- Costs measured from January 2020
- Demand measured from July 2019