Nonmetallic mineral products
Industry profile, February 2020
Sections: Description | Pricing | Costs | Demand | Appendix
This page is an industry profile for the Nonmetallic mineral products industry. It provides a general economic overview of recent developments in the industry. This includes information on industry pricing, costs, and demand. Below you will find a description of what type of business establishments are included in this industry. For information on how to best utilize this industry profile please visit our Business Solutions.
Industry Description
The Nonmetallic Mineral Product Manufacturing subsector transforms mined or quarried nonmetallic minerals, such as sand, gravel, stone, clay, and refractory materials, into products for intermediate or final consumption. Processes used include grinding, mixing, cutting, shaping, and honing. Heat often is used in the process and chemicals are frequently mixed to change the composition, purity, and chemical properties for the intended product. For example, glass is produced by heating silica sand to the melting point (sometimes combined with cullet or recycled glass) and then drawn, floated, or blow molded to the desired shape or thickness. Refractory materials are heated and then formed into bricks or other shapes for use in industrial applications.
This industry description was sourced from the North American Industry Classification System.
To download this data, or to learn more about how pricing is measured, please contact us.
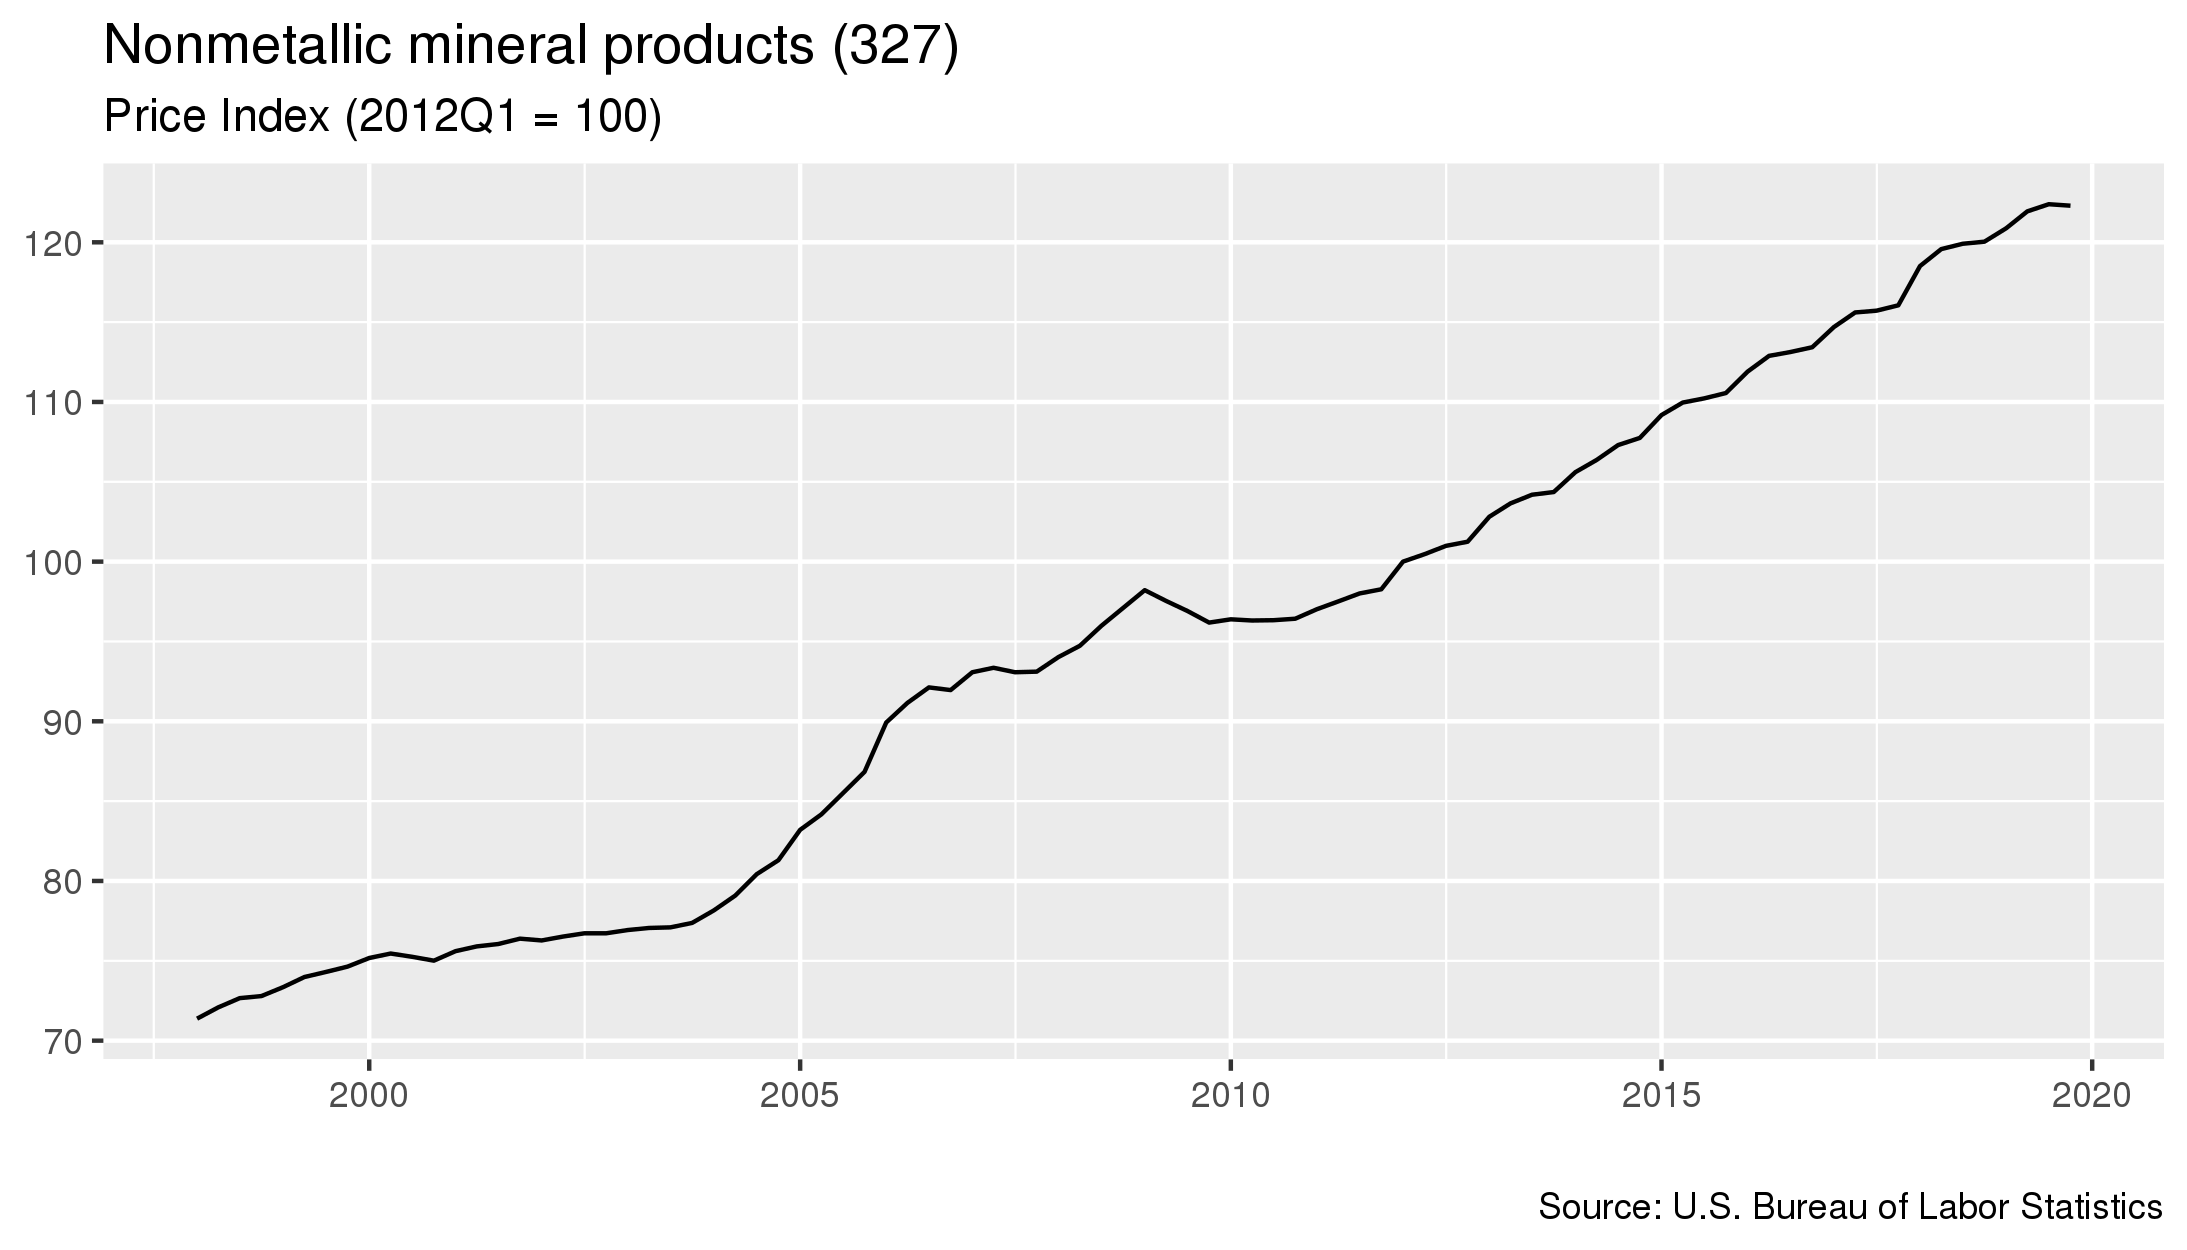
- As of January 2020, prices in this industry had decreased 0.1 percent since the previous quarter.
- From January 2019 to January 2020 prices in this industry increased 1.9 percent.
- Prices increased 10.6 percent in the five year period starting in January 2015 and ending in January 2020.
To download this data, or to learn more about how costs for this industry are measured, please contact us.
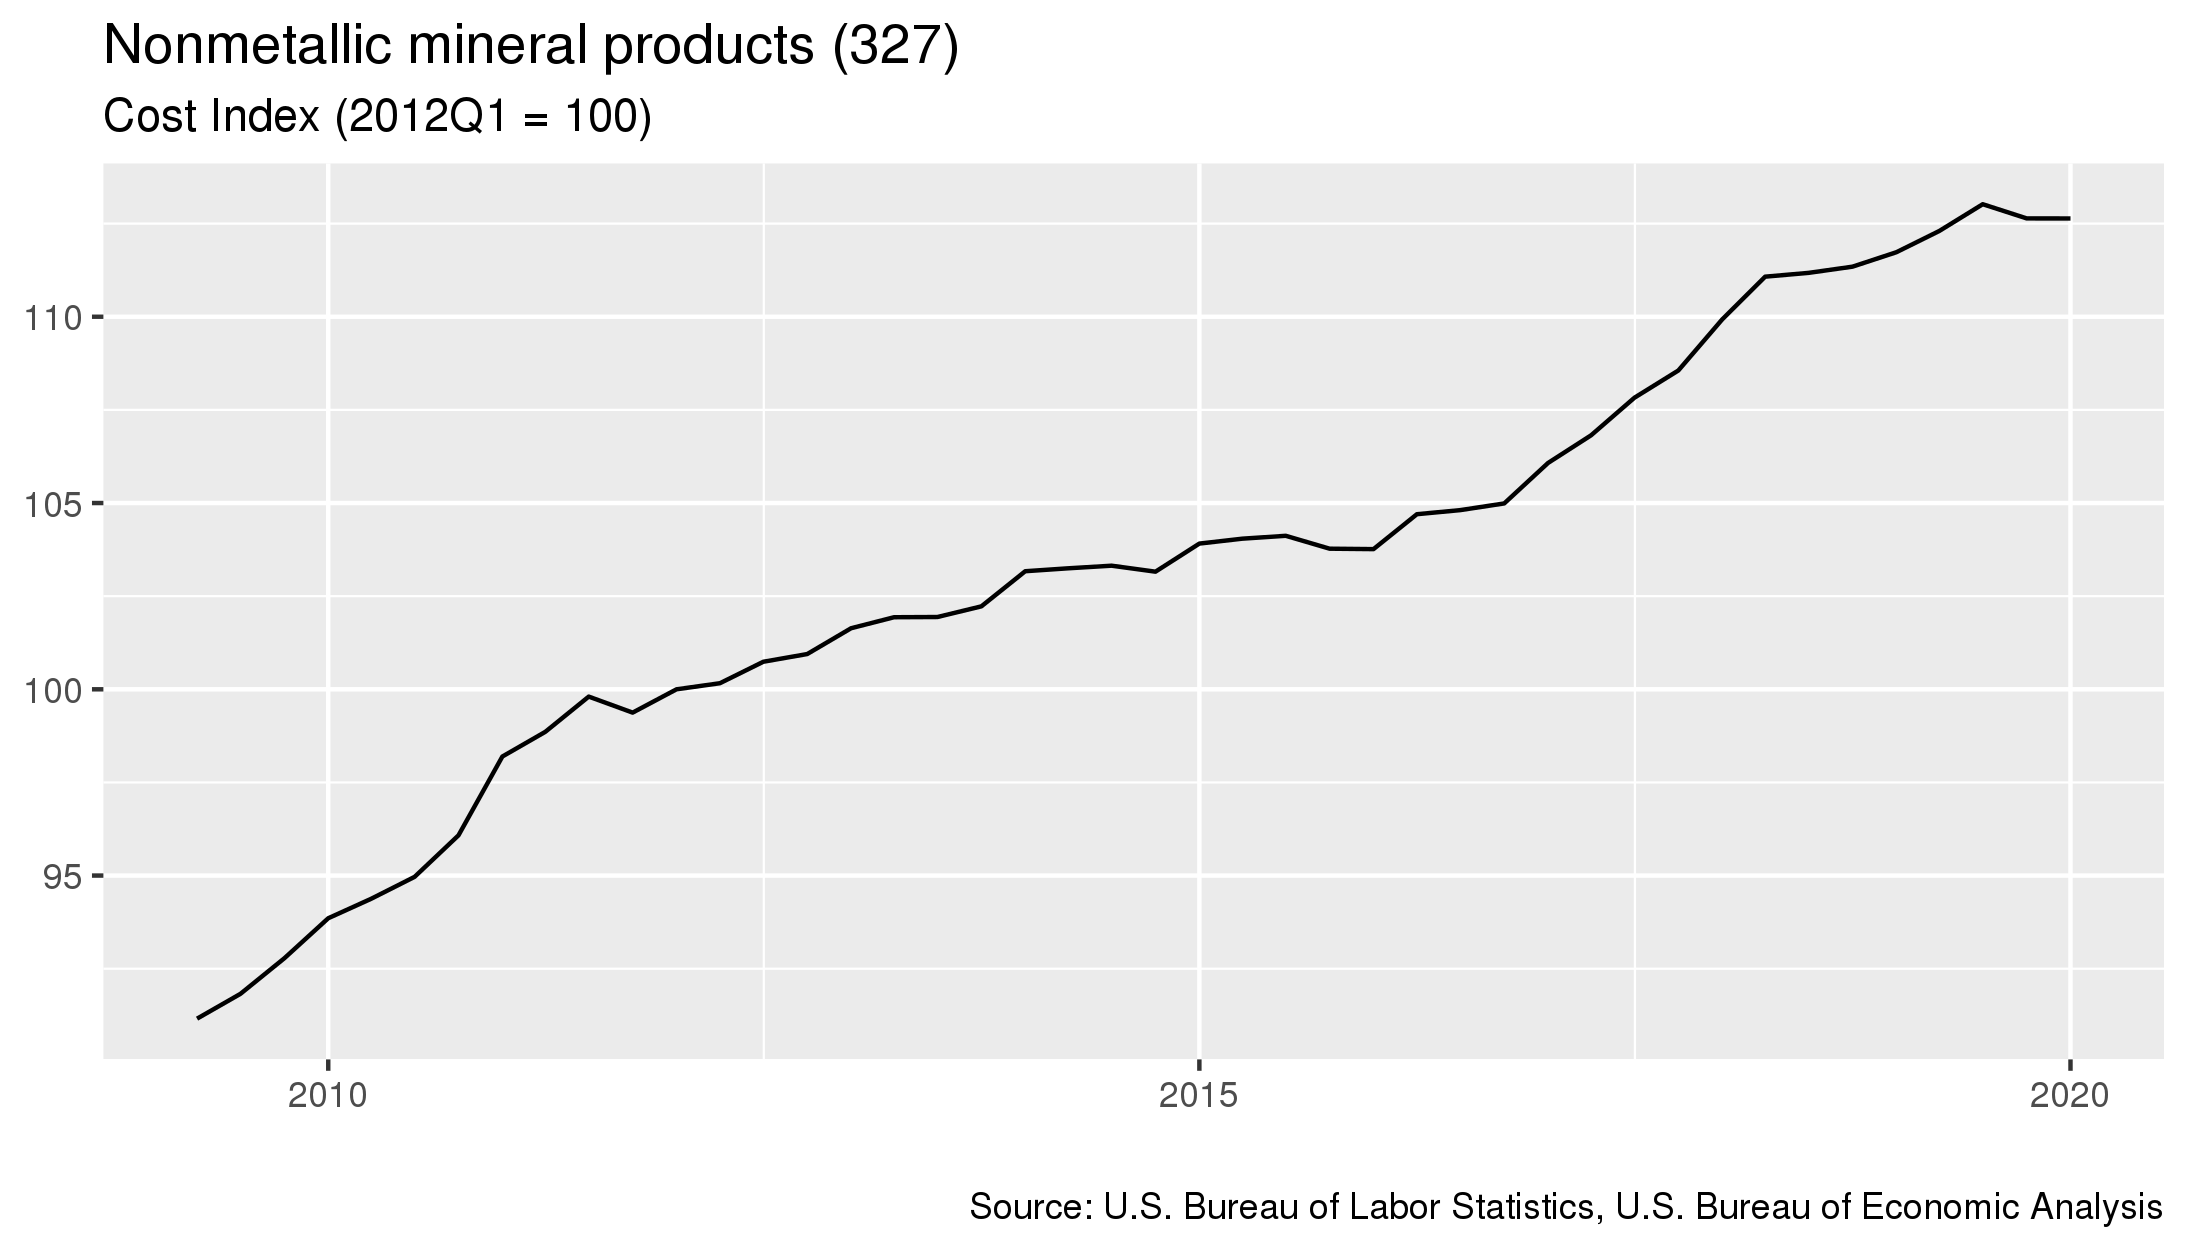
- As of January 2020, costs in this industry had 0 percent since the previous quarter.
- From January 2019 to January 2020 costs in this industry increased 0.8 percent.
- Costs increased 8.6 percent in the five year period starting in January 2015 and ending in January 2020.
For details on which industries are included in each sector, click here
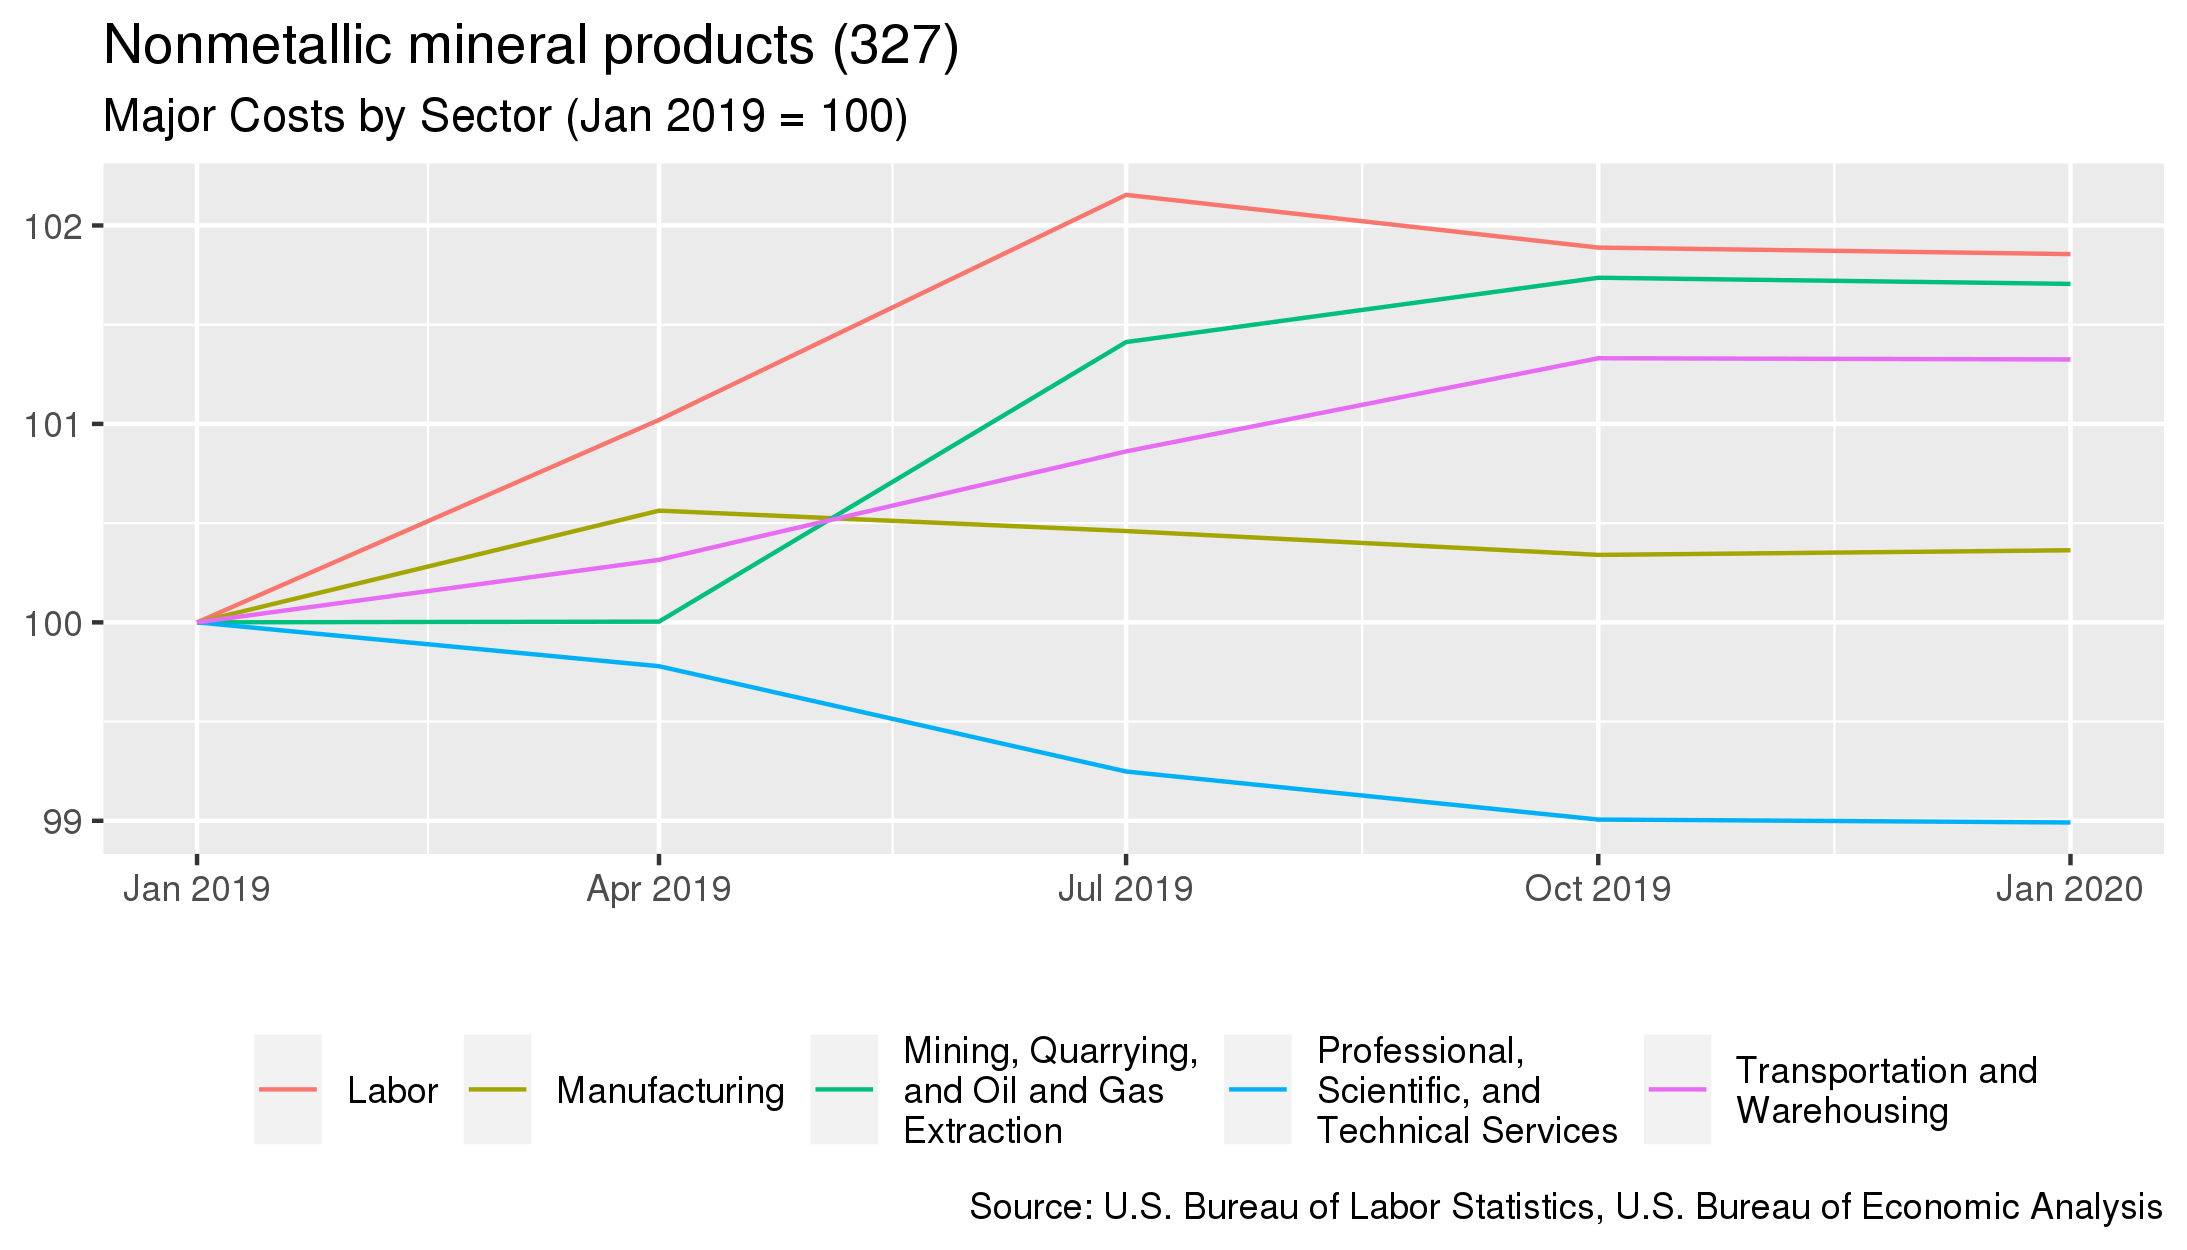
- The largest cost for this industry is purchases made to the Manufacturing sector. This sector accounts for 37.3% of the industry's overall costs.
- From January 2019 to January 2020, the largest change in costs for this industry were costs associated with purchases to the Labor sector. Costs associated with this sector increased 1.9%.
| Sector Name | Percentage of Costs | Annual Percent Change 4 |
|---|---|---|
| Manufacturing | 37.3% | +0.4% |
| Labor | 30.1% | +1.9% |
| Mining, Quarrying, and Oil and Gas Extraction | 13.2% | +1.7% |
| Professional, Scientific, and Technical Services | 3.4% | -1% |
| Transportation and Warehousing | 3.3% | +1.3% |
To download this data, or to learn more about how demand for this industry is measured, please contact us.
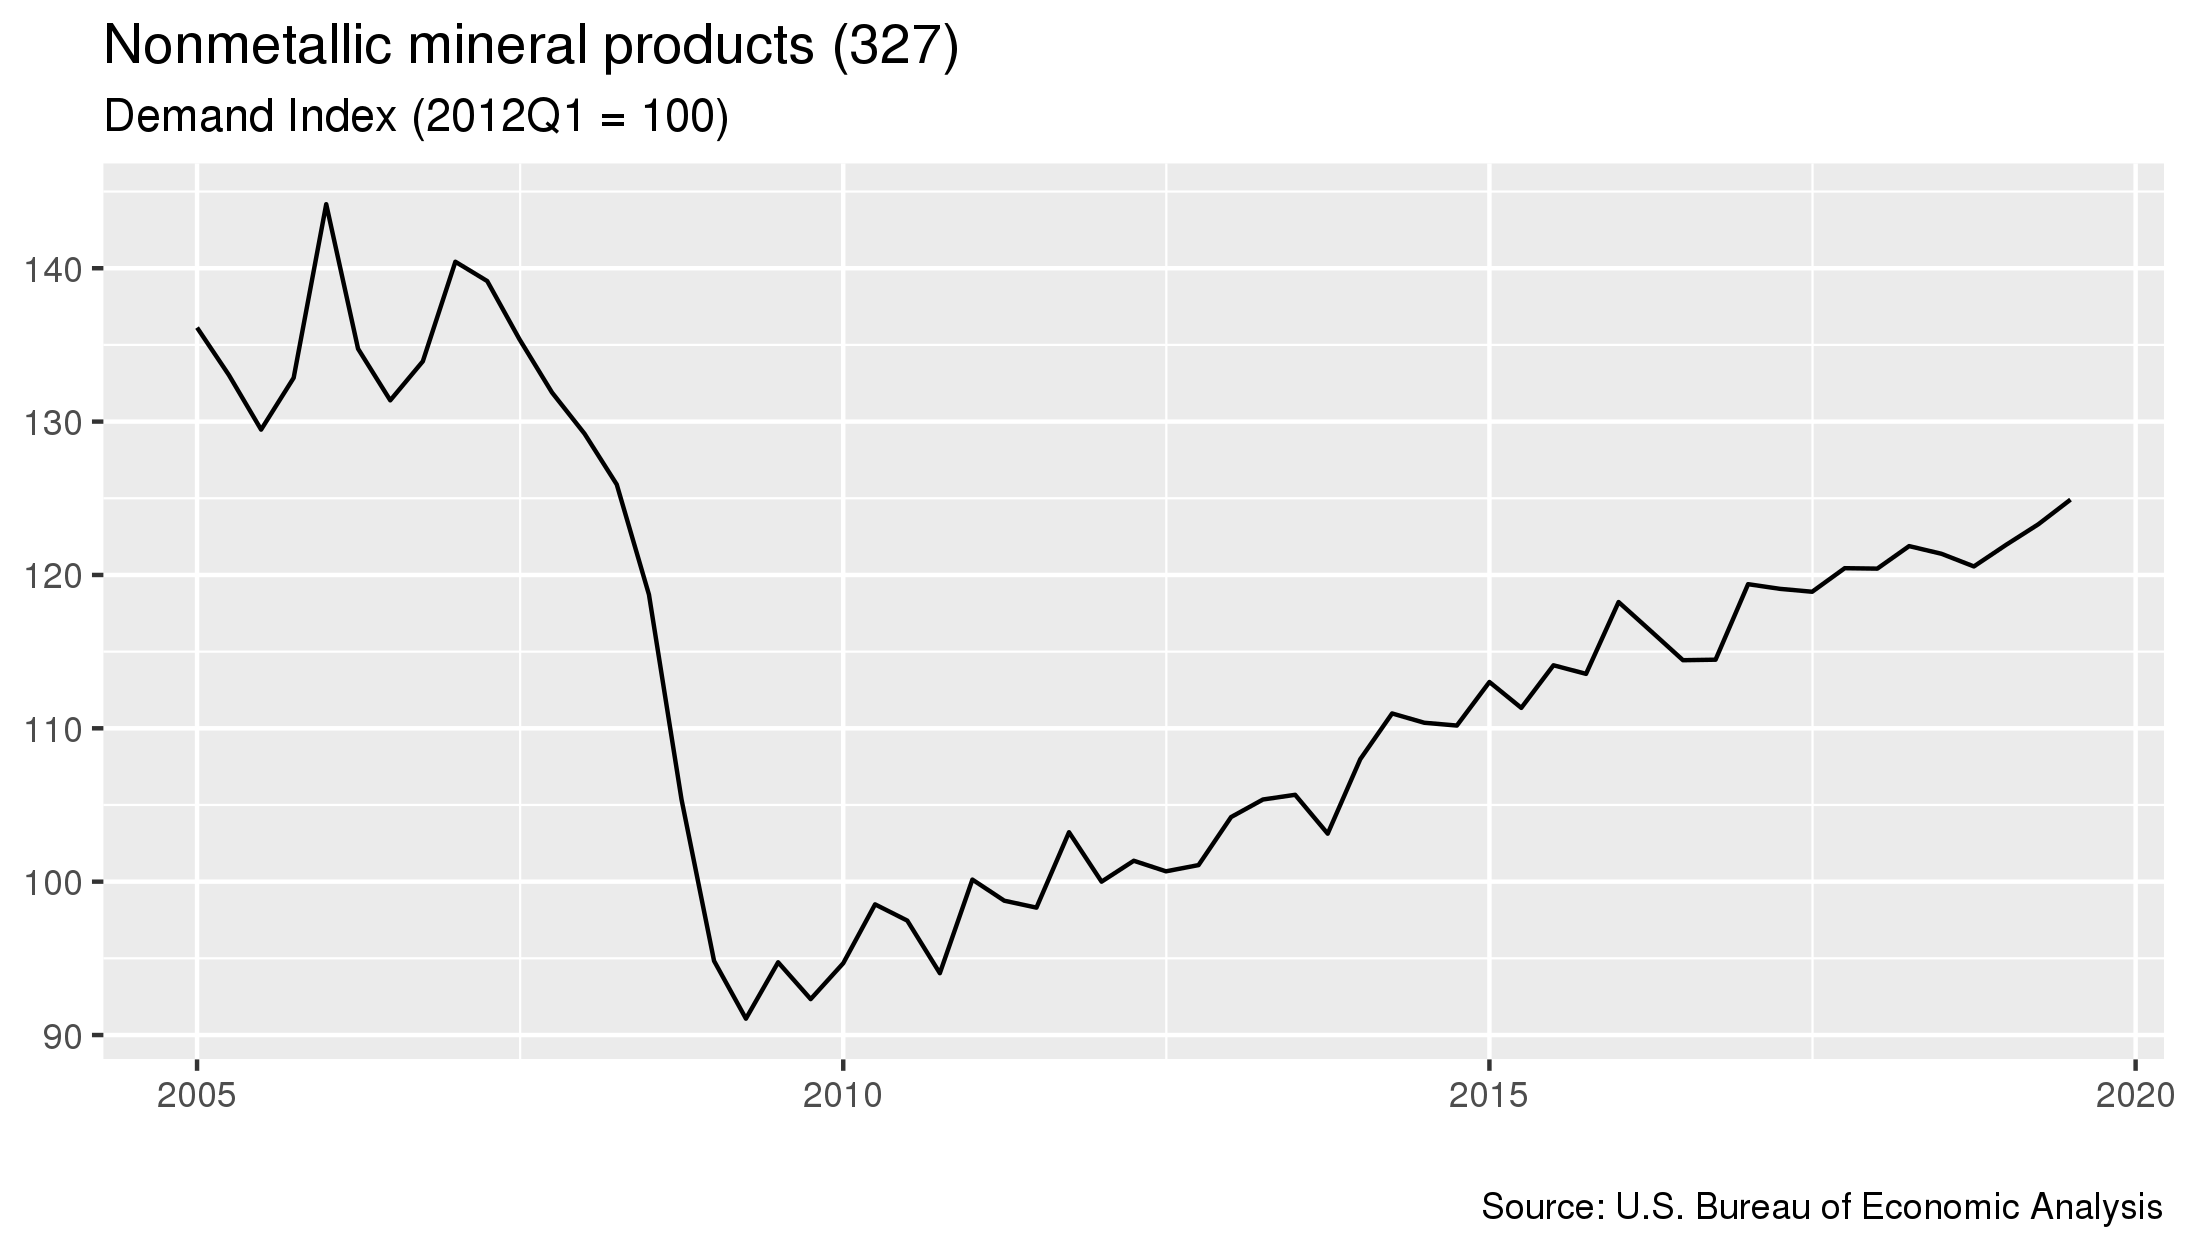
- As of July 2019, demand for this industry had increased 1.3 percent since the previous quarter.
- From July 2018 to January 2020 costs in this industry increased 2.9 percent.
- Costs increased 9.5 percent in the five year period starting in July 2014 and ending in July 2019.
For details on which industries are included in each sector, click here
- The sector that contributes the most to this industry's demand is the Construction sector. This sector accounts for 41.1% of the industry's overall demand.
- From January 2019 to January 2020, the largest change in demand for this industry was from the Exports sector, where demand increased 45.3%.
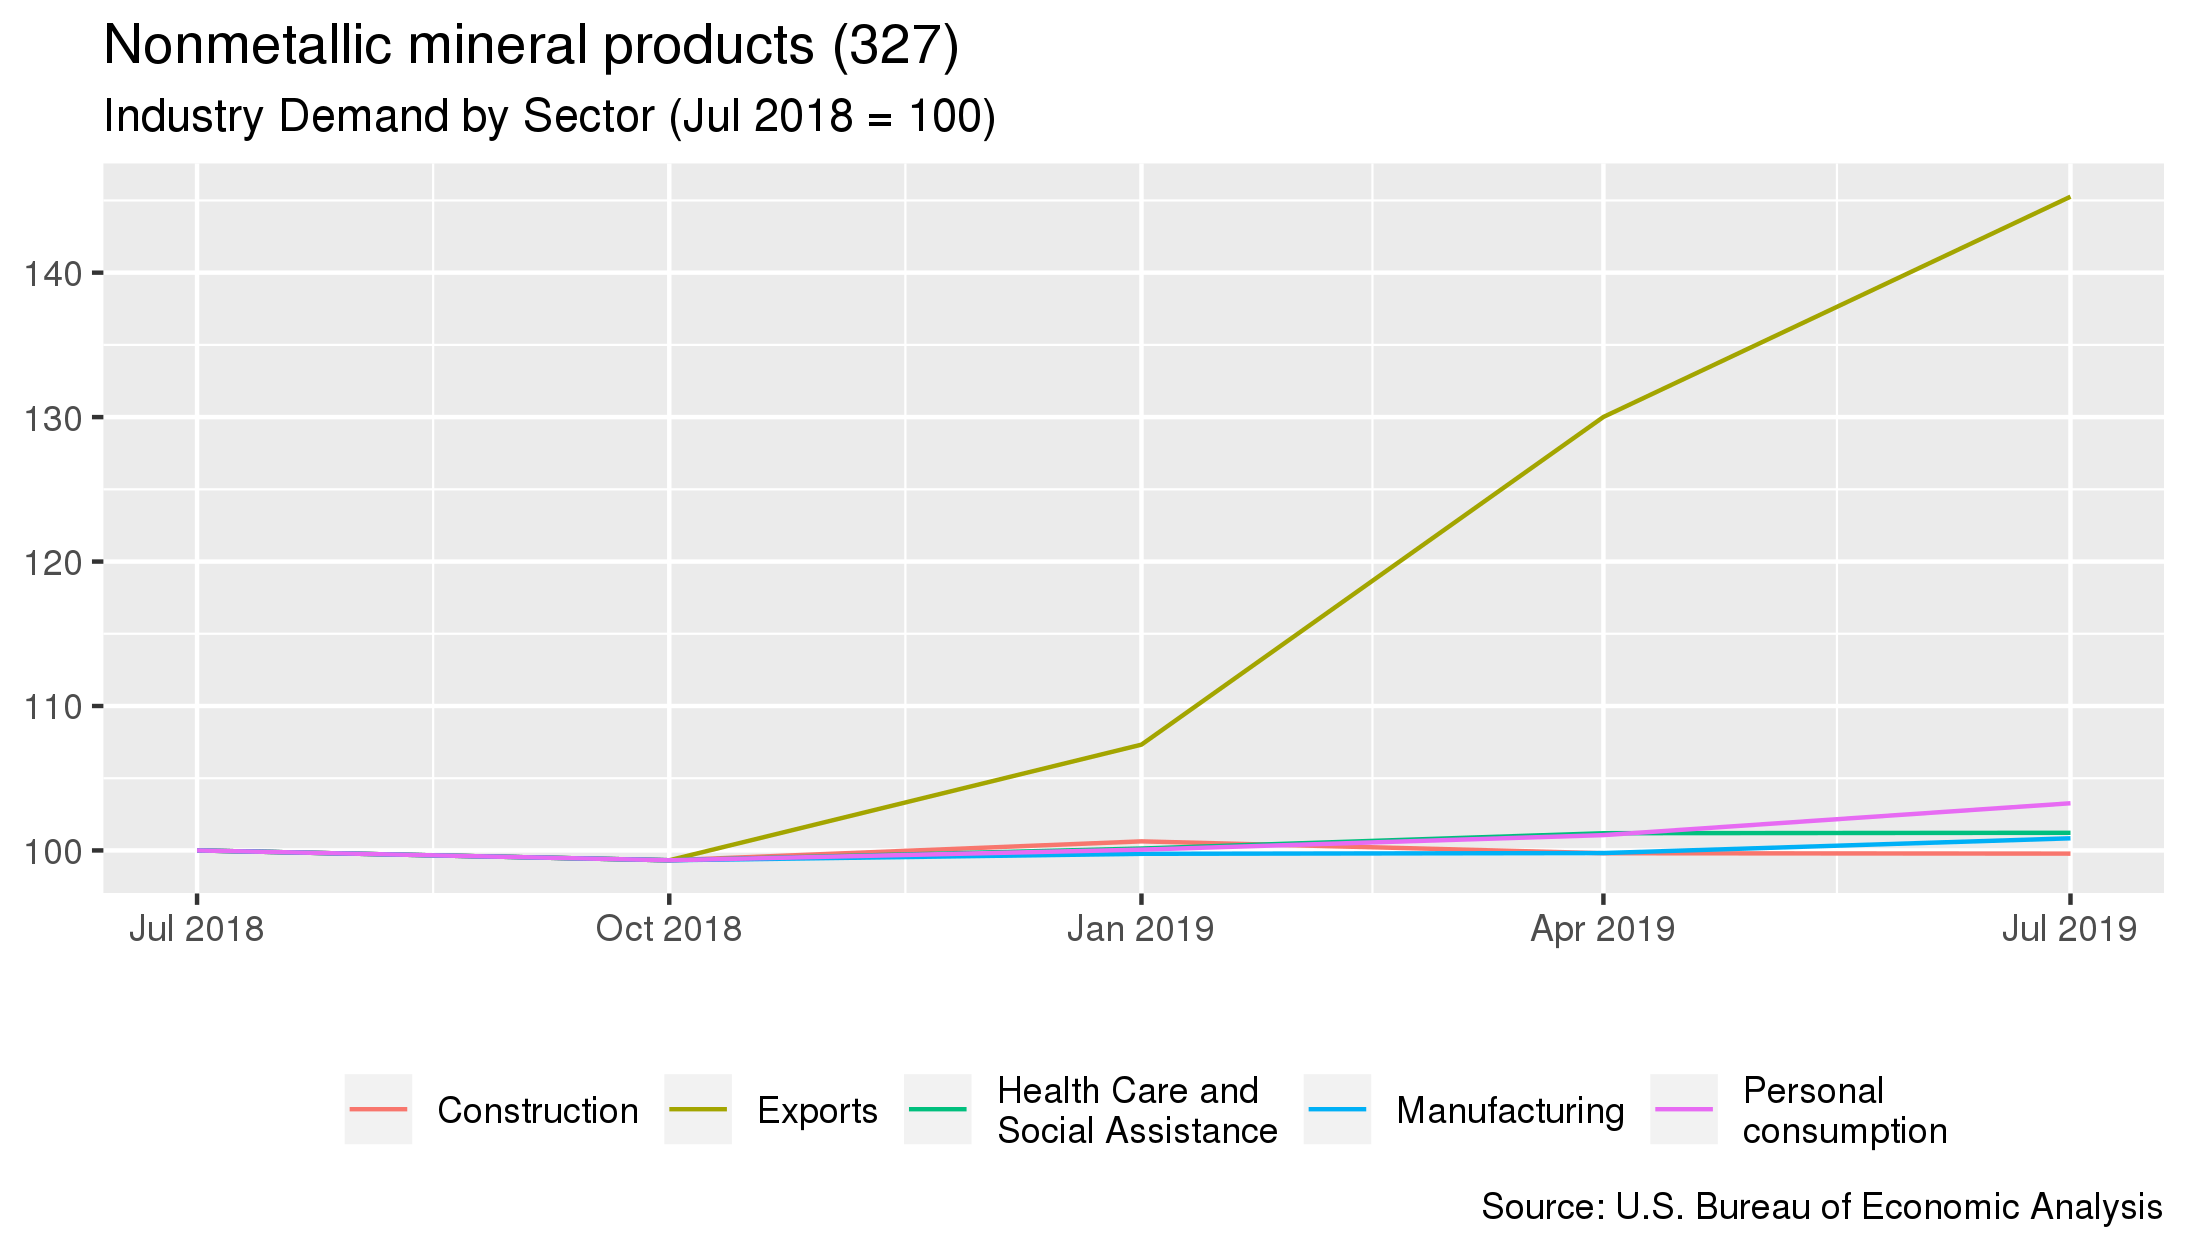
| Sector Name | Percentage of Demand | Annual Percent Change 6 |
|---|---|---|
| Construction | 41.1% | -0.2% |
| Manufacturing | 24.8% | +0.8% |
| Personal consumption | 10.6% | +3.3% |
| Exports | 7.1% | +45.3% |
| Health Care and Social Assistance | 3% | +1.2% |
- Pricing measured from January 2020.
- The BLS PPI used for this industry is PCU327---327---.
- Costs measured from January 2020
- Demand measured from July 2019