Electrical equipment, appliances, and components
Industry profile, February 2020
Sections: Description | Pricing | Costs | Demand | Appendix
This page is an industry profile for the Electrical equipment, appliances, and components industry. It provides a general economic overview of recent developments in the industry. This includes information on industry pricing, costs, and demand. Below you will find a description of what type of business establishments are included in this industry. For information on how to best utilize this industry profile please visit our Business Solutions.
Industry Description
Industries in the Electrical Equipment, Appliance, and Component Manufacturing subsector manufacture products that generate, distribute and use electrical power. Electric Lighting Equipment Manufacturing establishments produce electric lamp bulbs, lighting fixtures, and parts. Household Appliance Manufacturing establishments make both small and major electrical appliances and parts. Electrical Equipment Manufacturing establishments make goods, such as electric motors, generators, transformers, and switchgear apparatus. Other Electrical Equipment and Component Manufacturing establishments make devices for storing electrical power (e.g., batteries), for transmitting electricity (e.g., insulated wire), and wiring devices (e.g., electrical outlets, fuse boxes, and light switches).
This industry description was sourced from the North American Industry Classification System.
To download this data, or to learn more about how pricing is measured, please contact us.
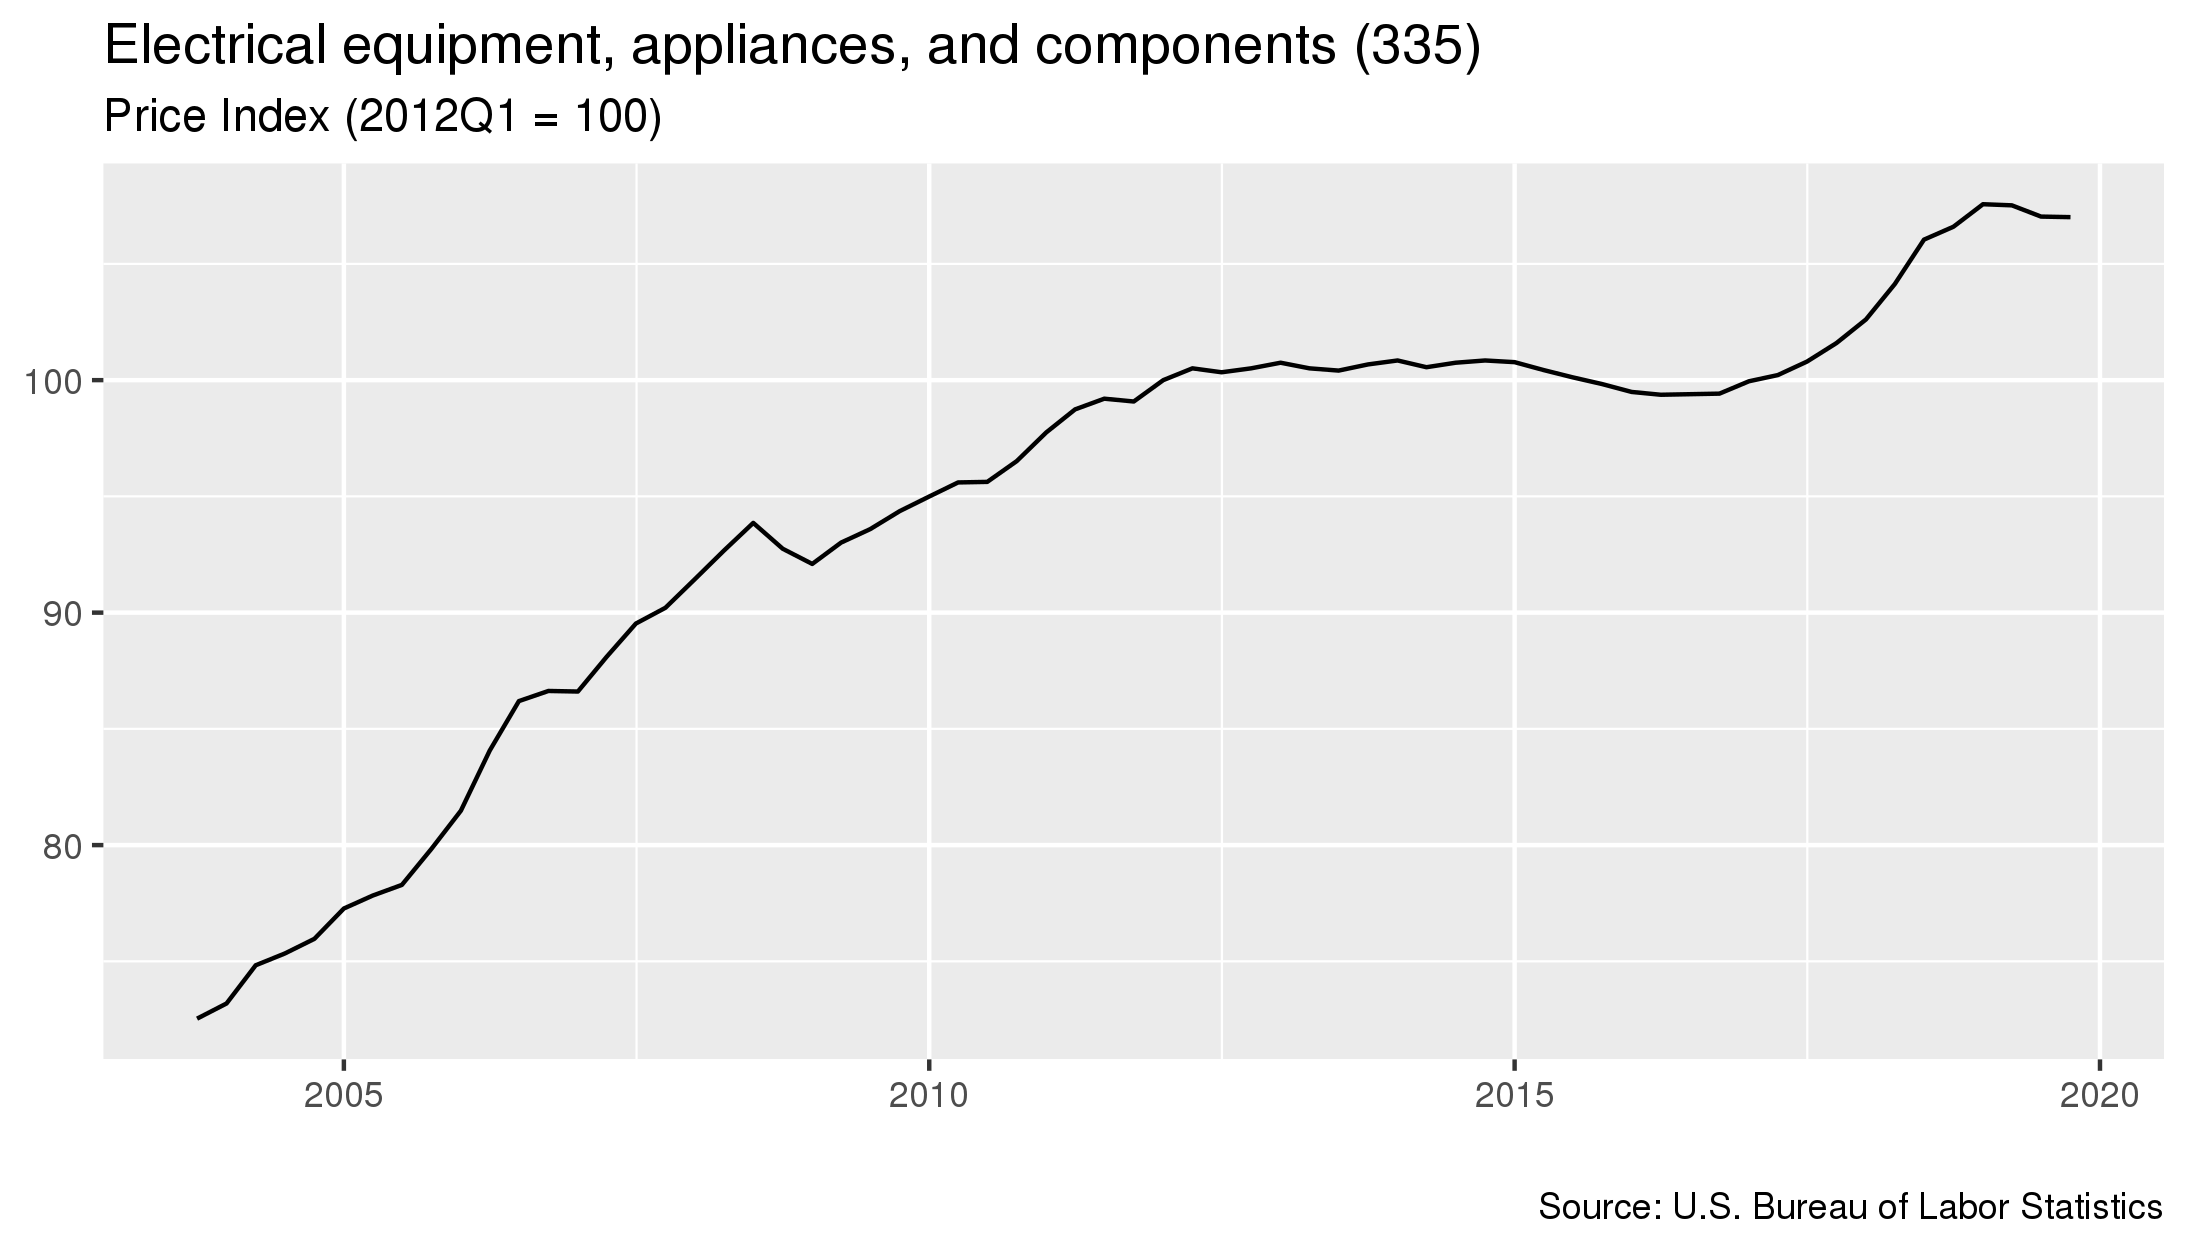
- As of January 2020, prices in this industry had 0 percent since the previous quarter.
- From January 2019 to January 2020 prices in this industry increased 0.4 percent.
- Prices increased 7.2 percent in the five year period starting in January 2015 and ending in January 2020.
To download this data, or to learn more about how costs for this industry are measured, please contact us.
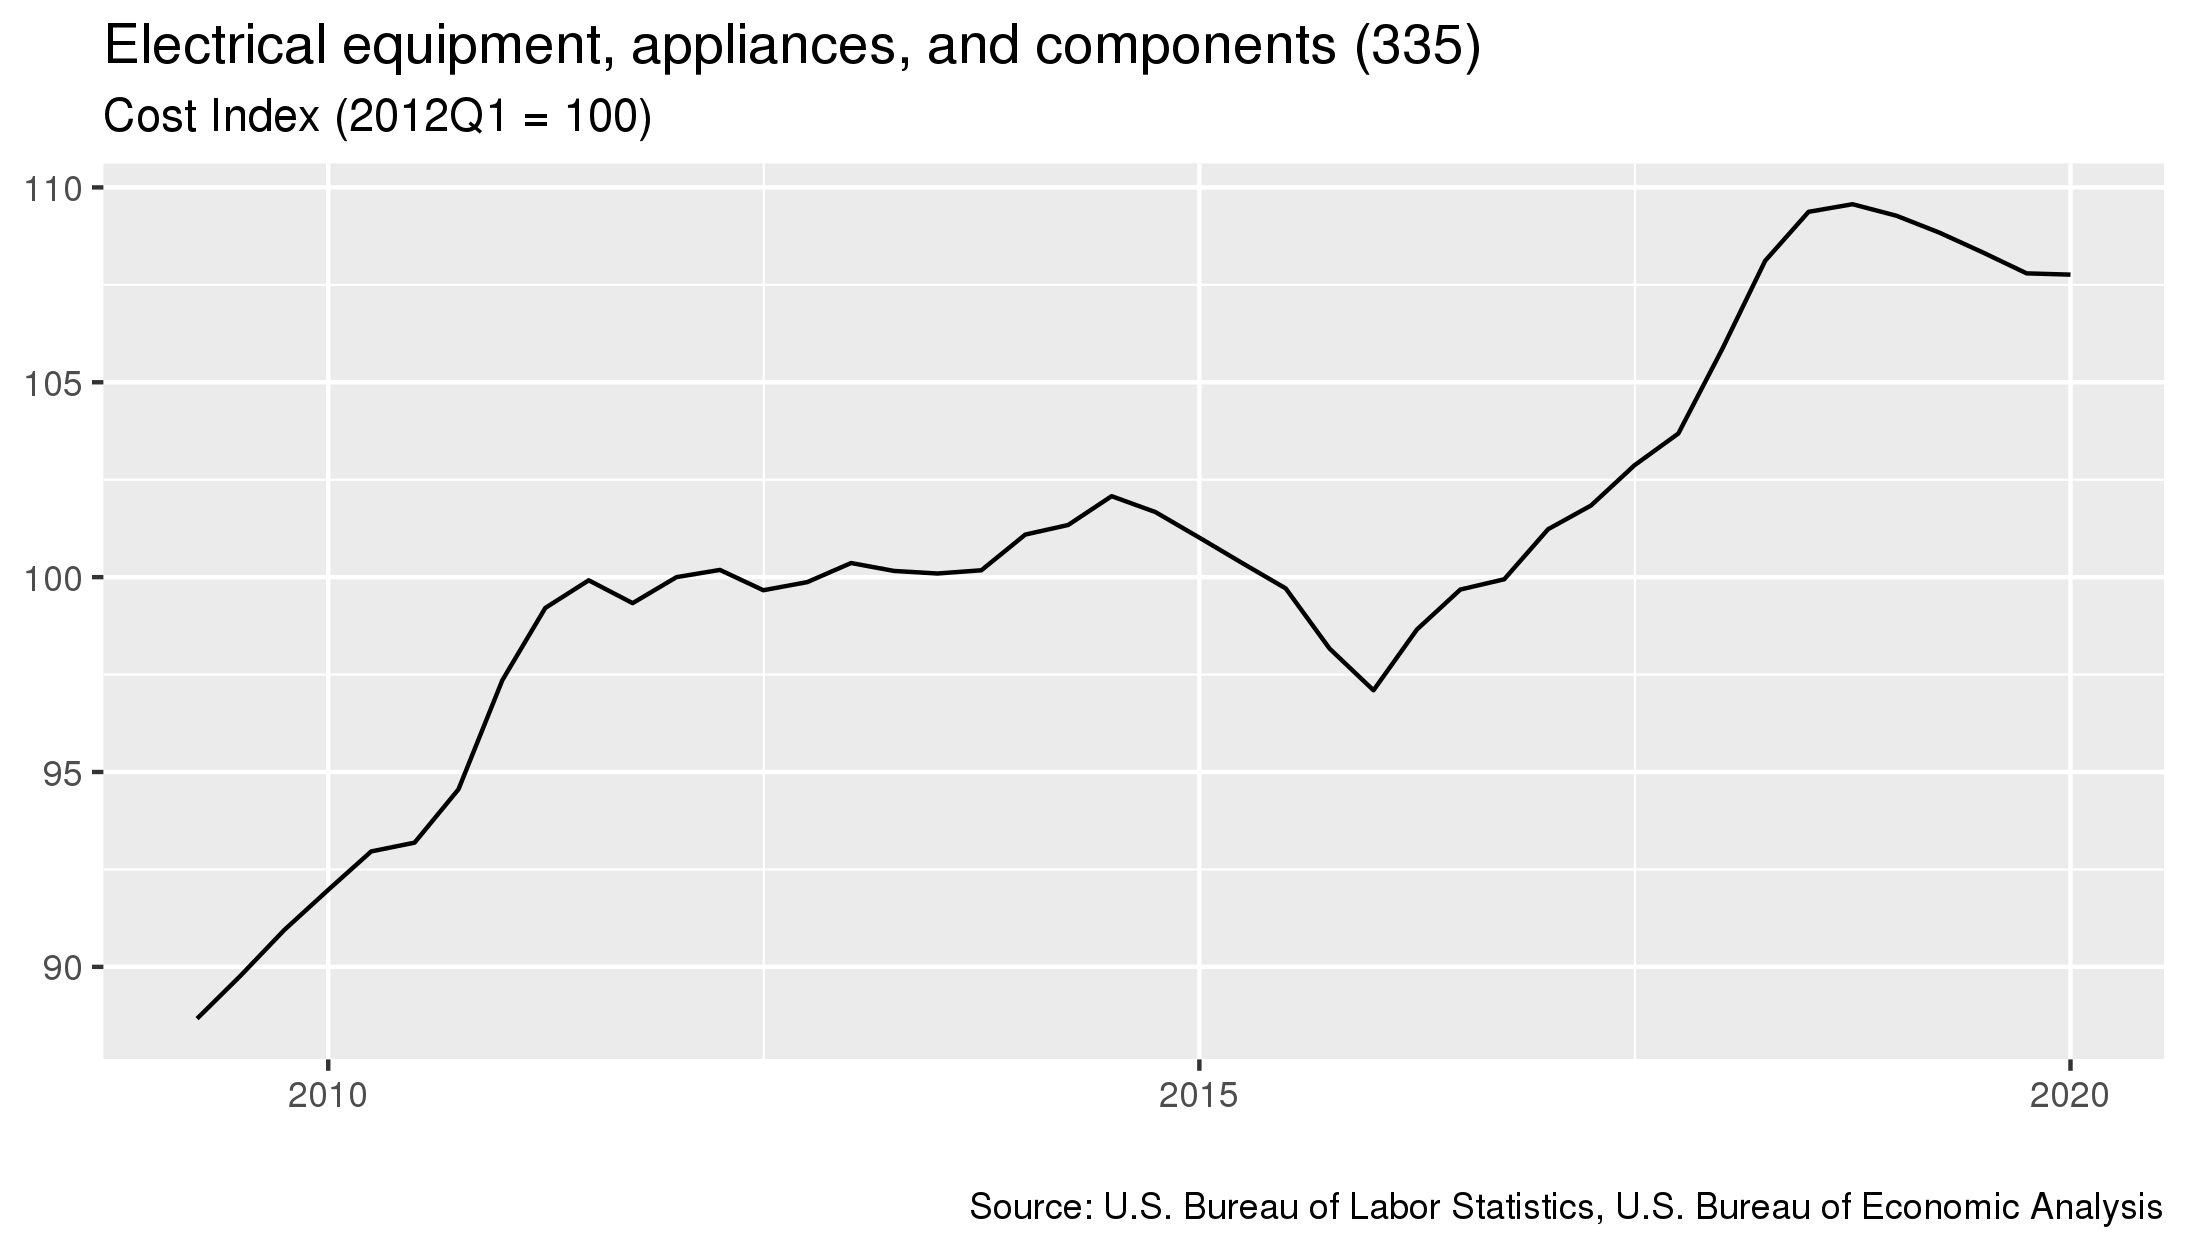
- As of January 2020, costs in this industry had 0 percent since the previous quarter.
- From January 2019 to January 2020 costs in this industry decreased 1.4 percent.
- Costs increased 11 percent in the five year period starting in January 2015 and ending in January 2020.
For details on which industries are included in each sector, click here
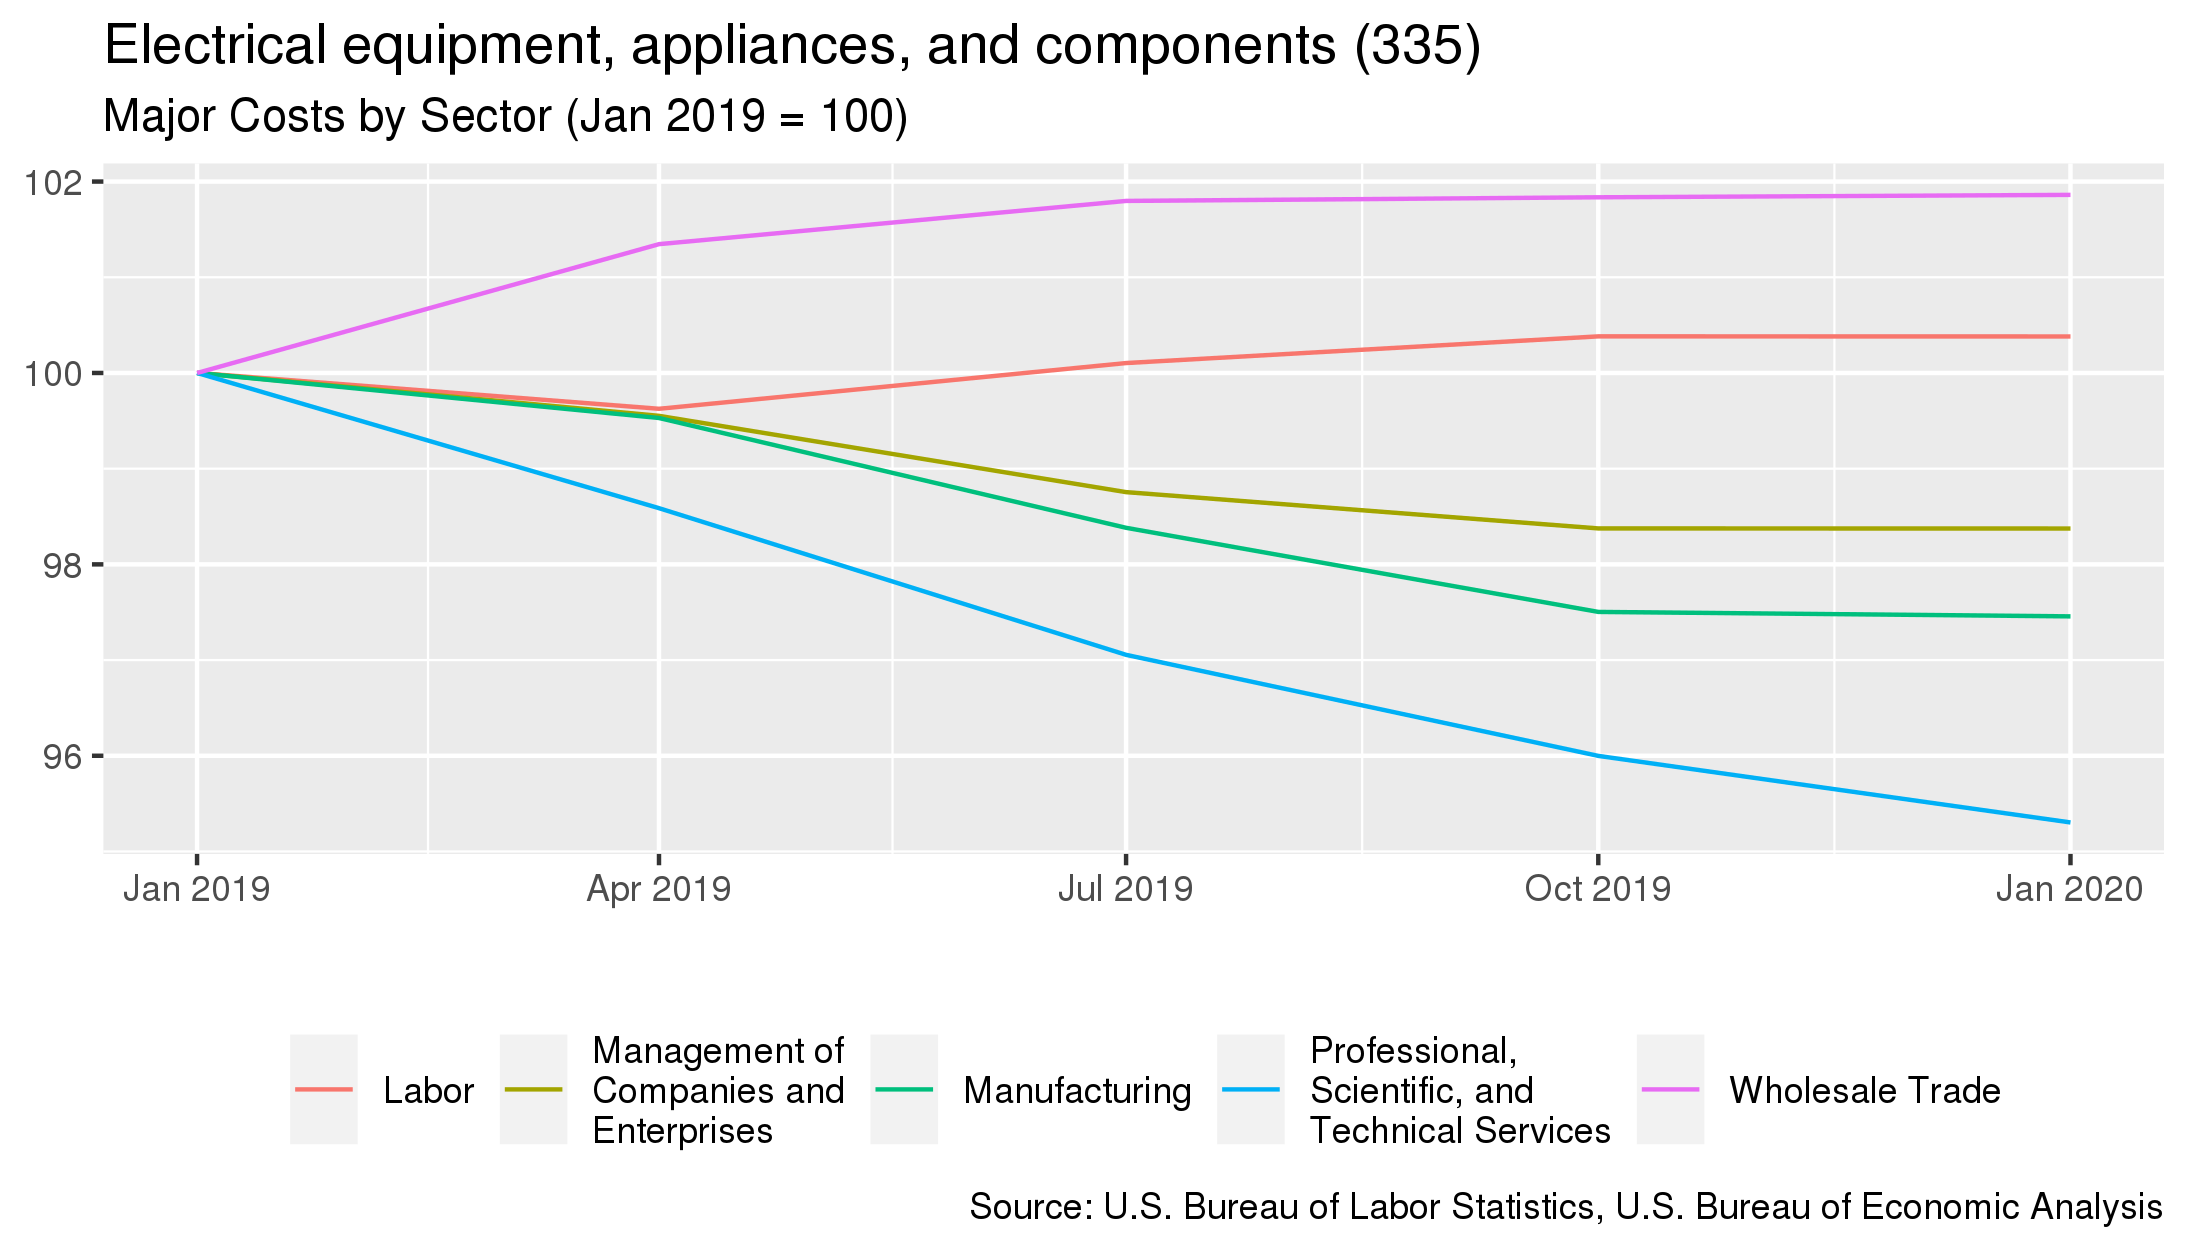
- The largest cost for this industry is purchases made to the Manufacturing sector. This sector accounts for 54.7% of the industry's overall costs.
- From January 2019 to January 2020, the largest change in costs for this industry were costs associated with purchases to the Professional, Scientific, and Technical Services sector. Costs associated with this sector decreased -4.7%.
| Sector Name | Percentage of Costs | Annual Percent Change 4 |
|---|---|---|
| Manufacturing | 54.7% | -2.5% |
| Labor | 35.3% | +0.4% |
| Wholesale Trade | 1.9% | +1.9% |
| Professional, Scientific, and Technical Services | 1.8% | -4.7% |
| Management of Companies and Enterprises | 1.4% | -1.6% |
To download this data, or to learn more about how demand for this industry is measured, please contact us.
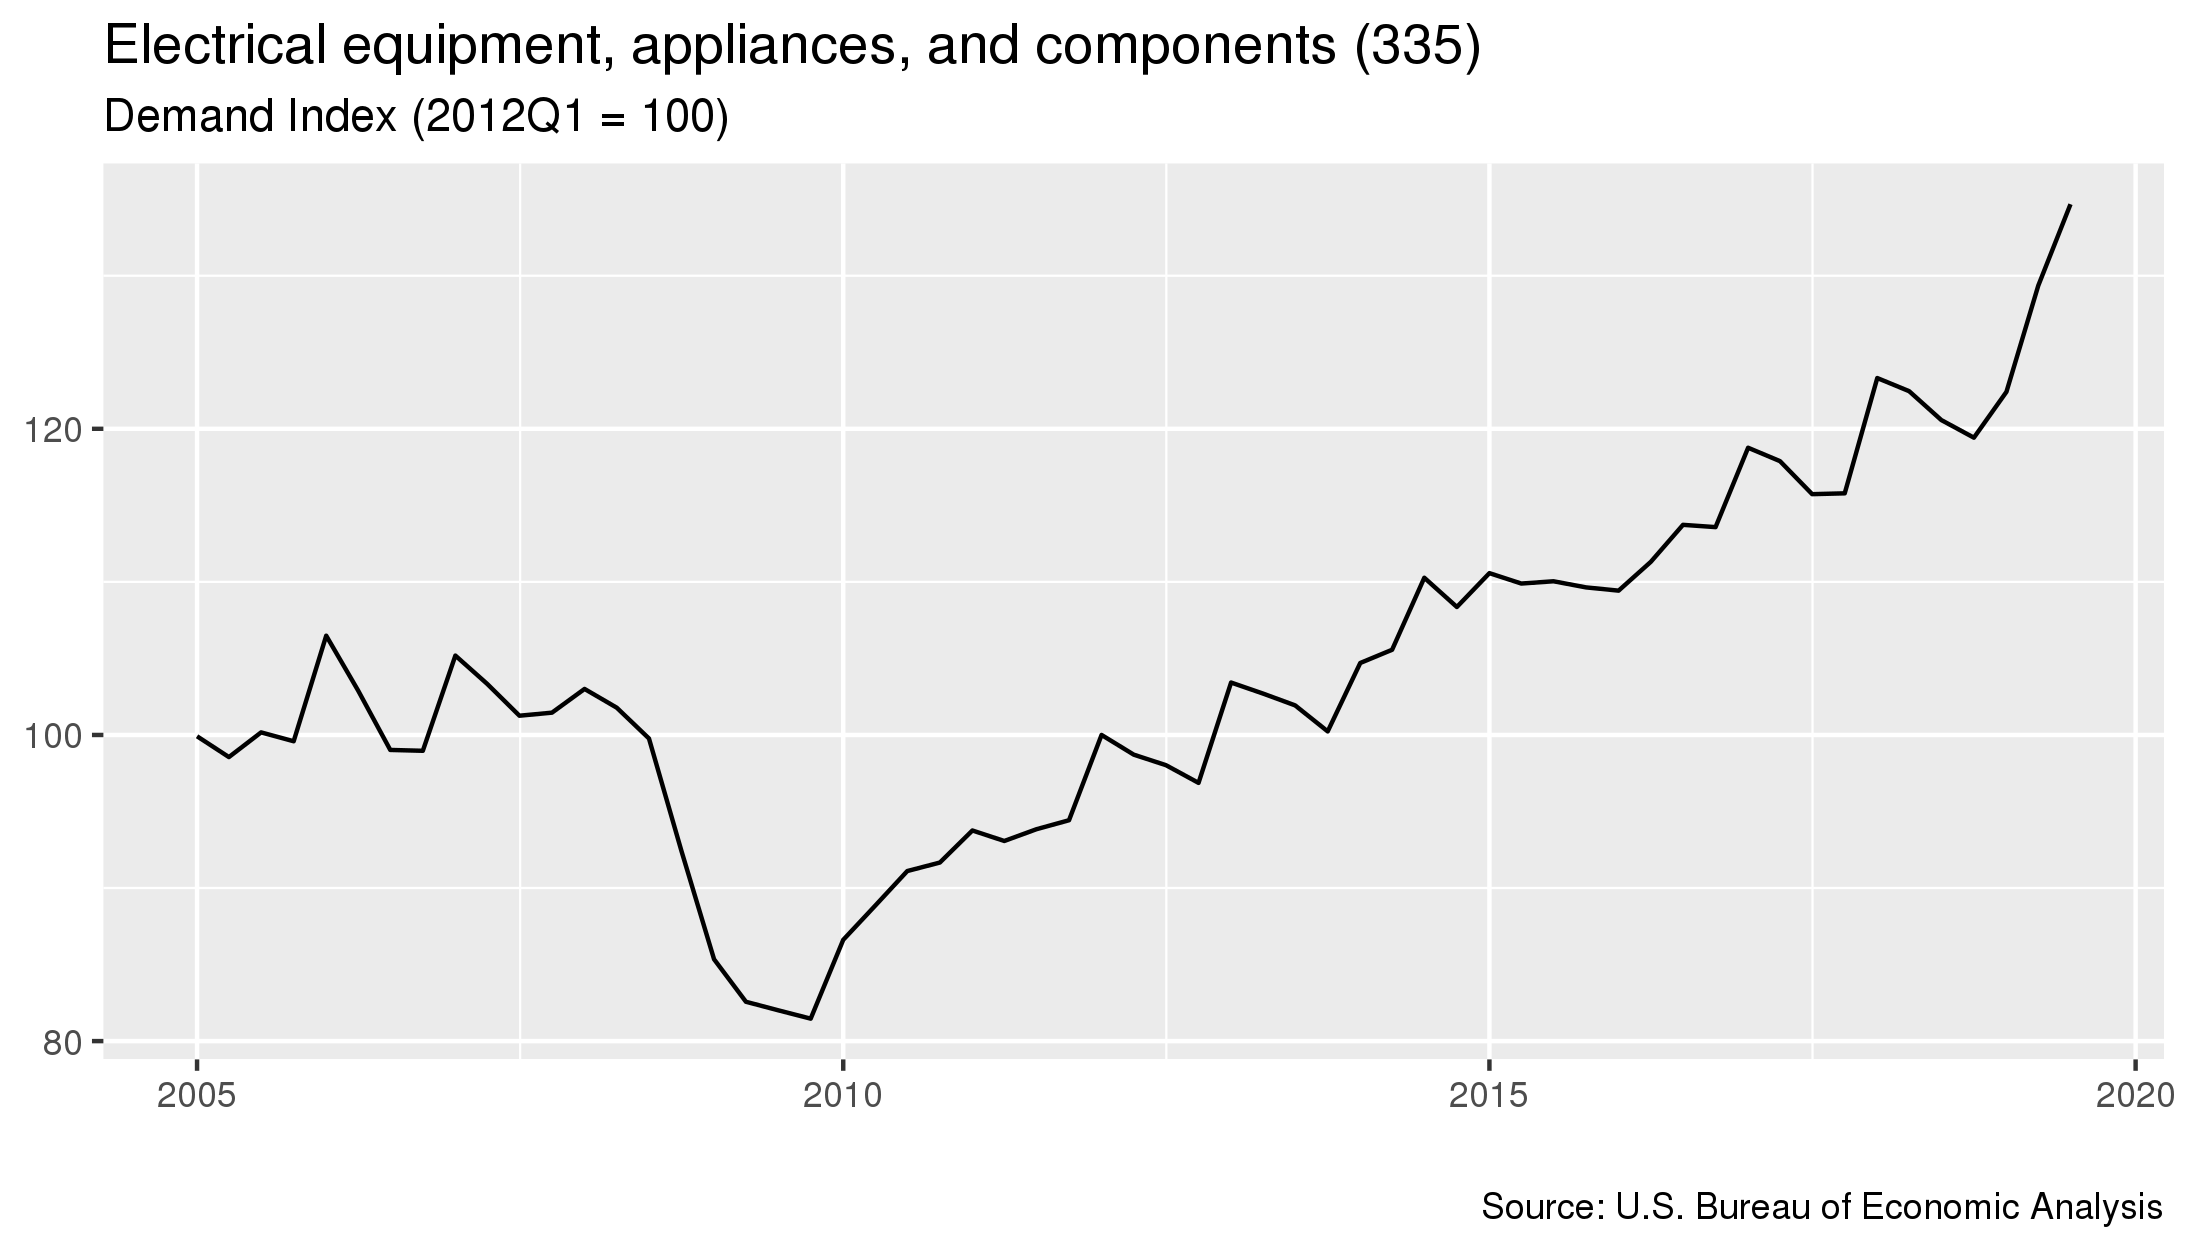
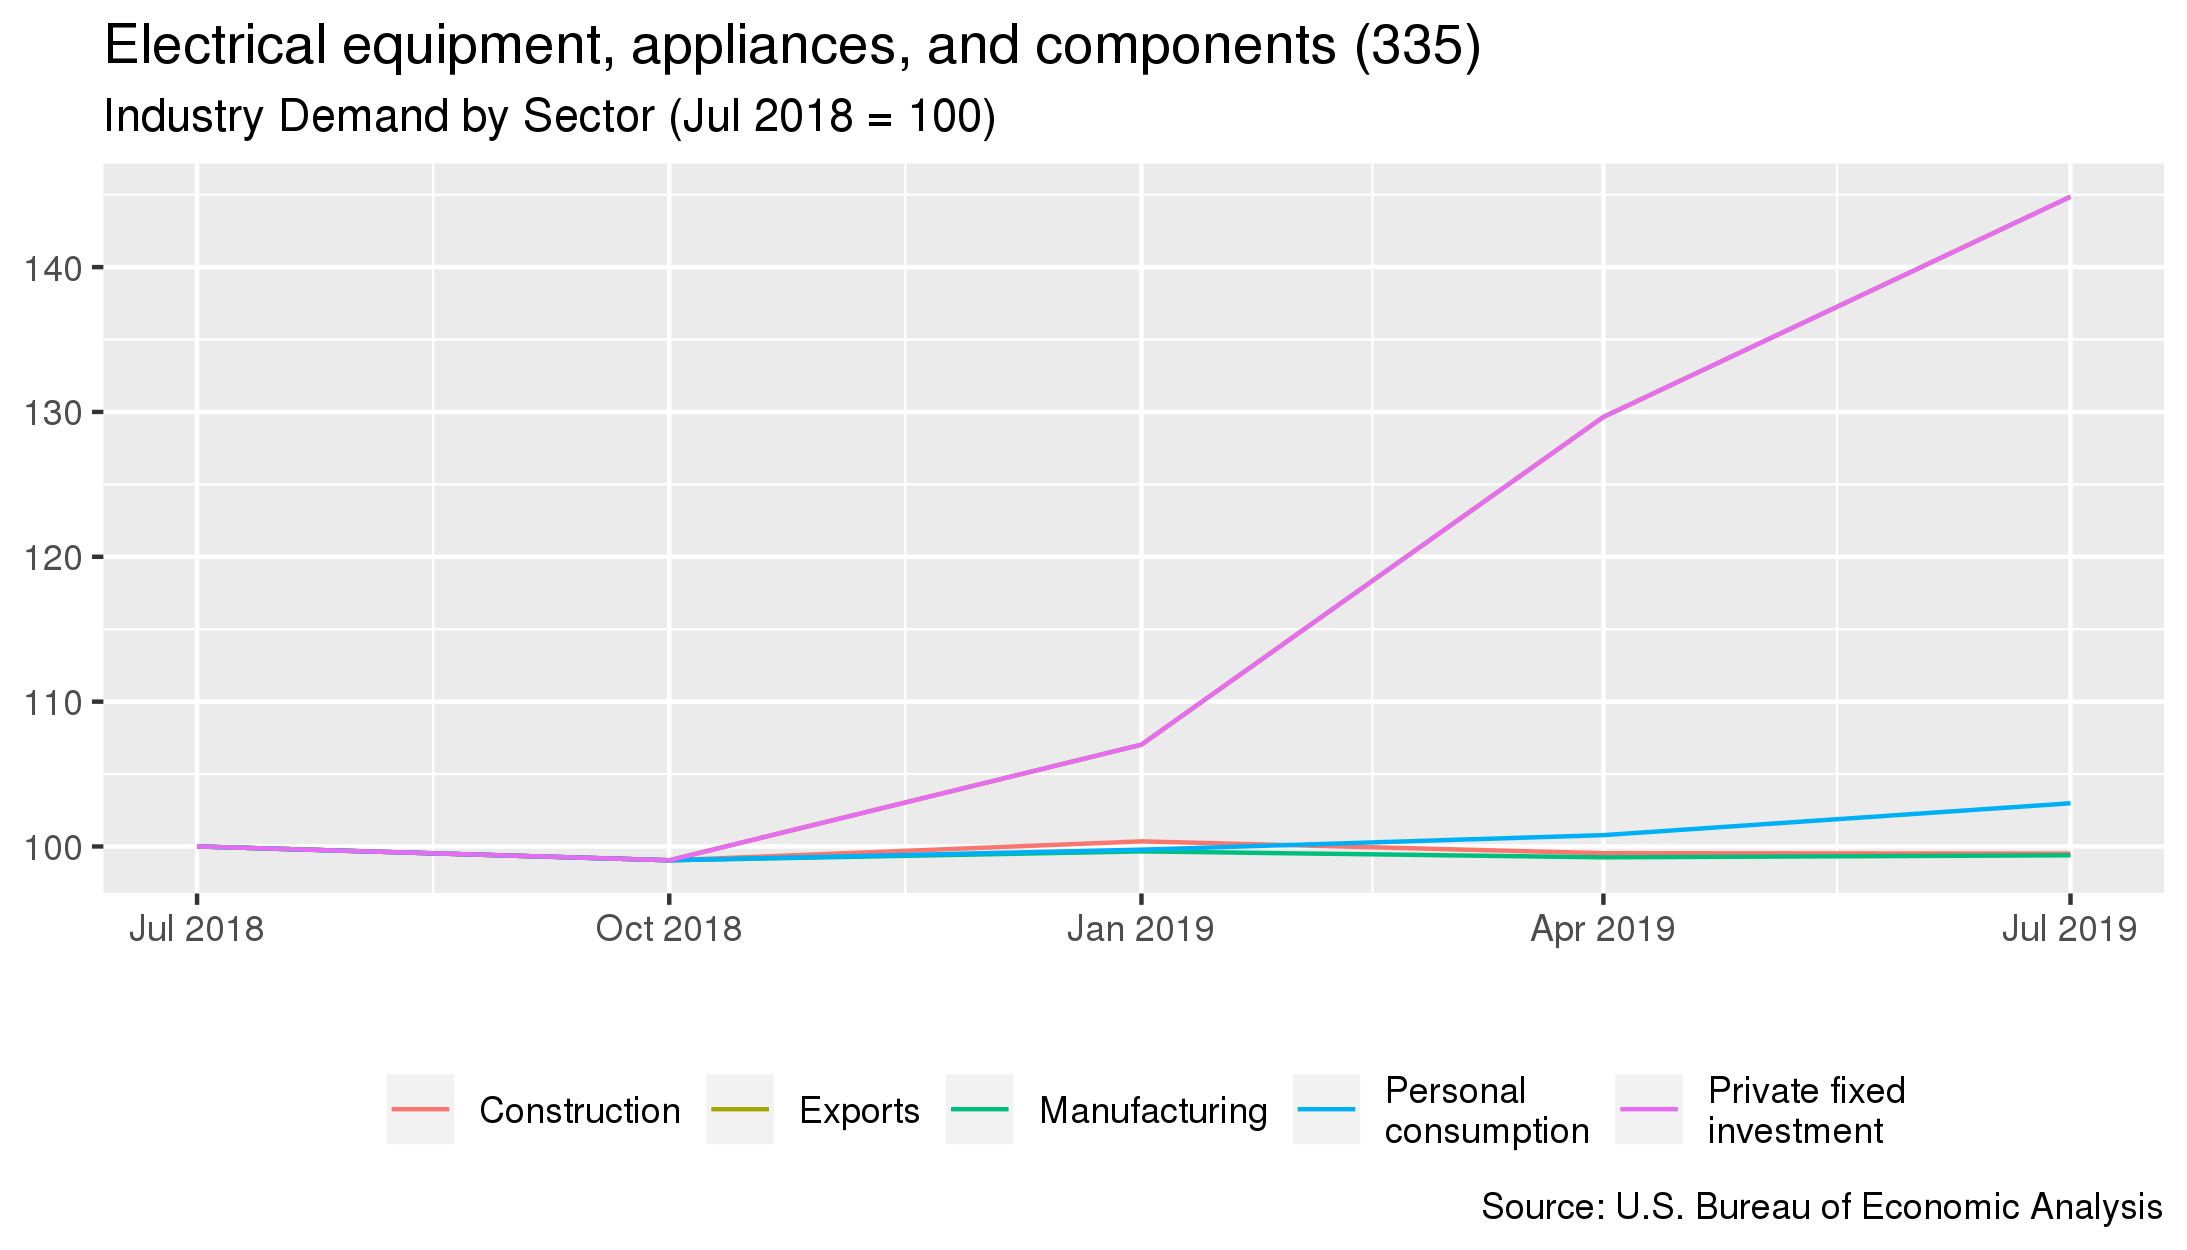
- As of July 2019, demand for this industry had increased 4.1 percent since the previous quarter.
- From July 2018 to January 2020 costs in this industry increased 11.7 percent.
- Costs increased 22.4 percent in the five year period starting in July 2014 and ending in July 2019.
For details on which industries are included in each sector, click here
- The sector that contributes the most to this industry's demand is the Personal consumption sector. This sector accounts for 23.4% of the industry's overall demand.
- From January 2019 to January 2020, the largest change in demand for this industry was from the Exports sector, where demand increased 44.9%.
| Sector Name | Percentage of Demand | Annual Percent Change 6 |
|---|---|---|
| Personal consumption | 23.4% | +3% |
| Private fixed investment | 17.9% | +44.9% |
| Construction | 16% | -0.5% |
| Manufacturing | 15.2% | -0.6% |
| Exports | 13.9% | +44.9% |
- Pricing measured from January 2020.
- The BLS PPI used for this industry is PCU335---335---.
- Costs measured from January 2020
- Demand measured from July 2019