Furniture and related products
Industry profile, February 2020
Sections: Description | Pricing | Costs | Demand | Appendix
This page is an industry profile for the Furniture and related products industry. It provides a general economic overview of recent developments in the industry. This includes information on industry pricing, costs, and demand. Below you will find a description of what type of business establishments are included in this industry. For information on how to best utilize this industry profile please visit our Business Solutions.
Industry Description
Industries in the Furniture and Related Product Manufacturing subsector make furniture and related articles, such as mattresses, window blinds, cabinets, and fixtures. The processes used in the manufacture of furniture include the cutting, bending, molding, laminating, and assembly of such materials as wood, metal, glass, plastics, and rattan. However, the production process for furniture is not solely bending metal, cutting and shaping wood, or extruding and molding plastics. Design and fashion trends play an important part in the production of furniture. The integrated design of the article for both esthetic and functional qualities is also a major part of the process of manufacturing furniture. Design services may be performed by the furniture establishment's work force or may be purchased from industrial designers.
This industry description was sourced from the North American Industry Classification System.
To download this data, or to learn more about how pricing is measured, please contact us.
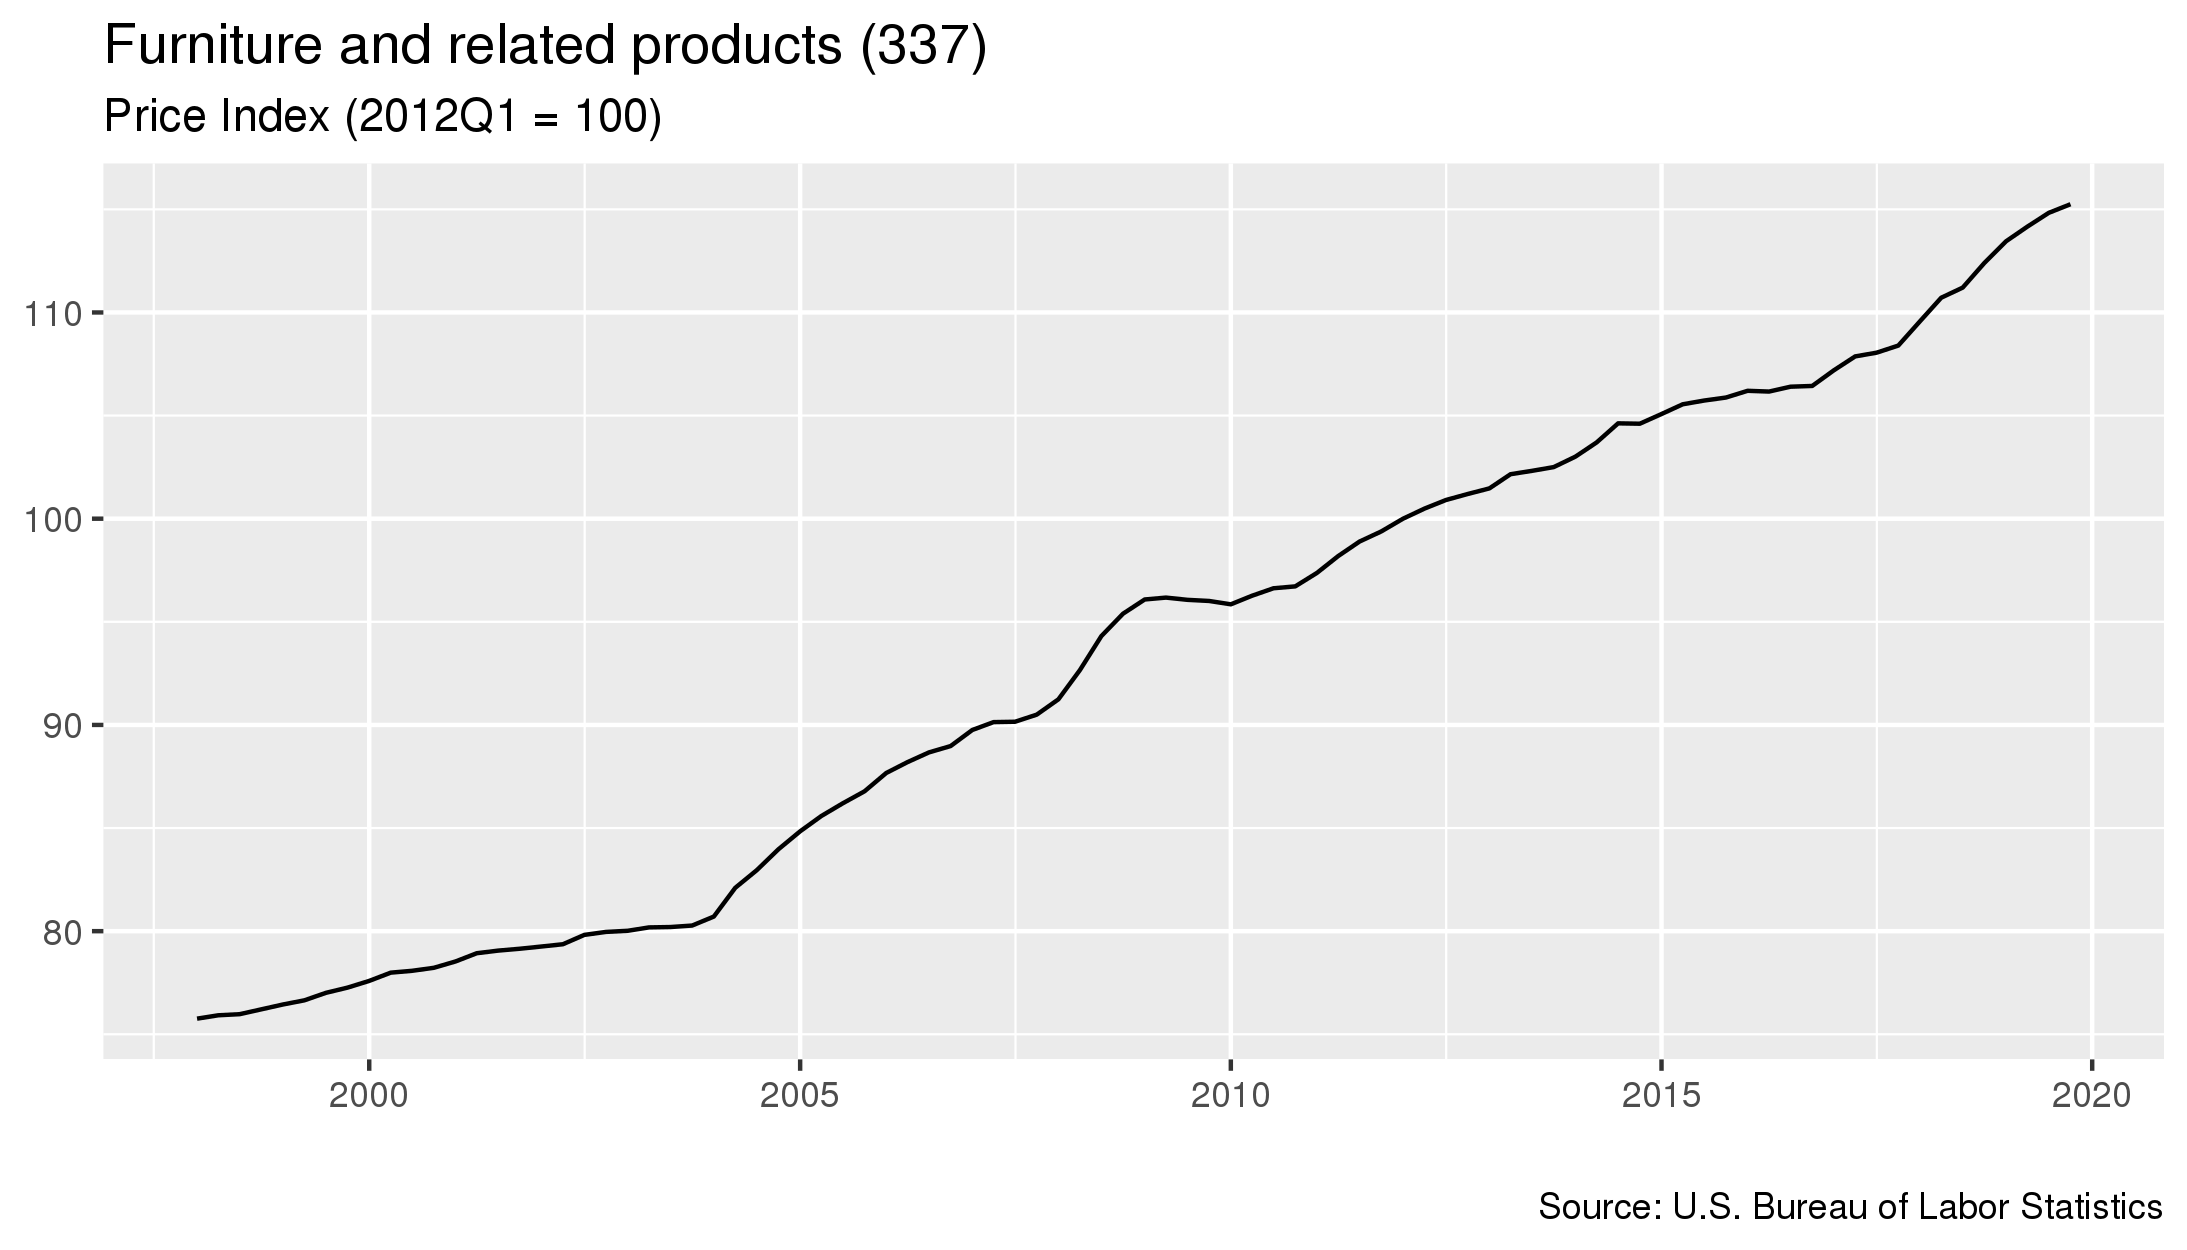
- As of January 2020, prices in this industry had increased 0.4 percent since the previous quarter.
- From January 2019 to January 2020 prices in this industry increased 2.5 percent.
- Prices increased 8.9 percent in the five year period starting in January 2015 and ending in January 2020.
To download this data, or to learn more about how costs for this industry are measured, please contact us.
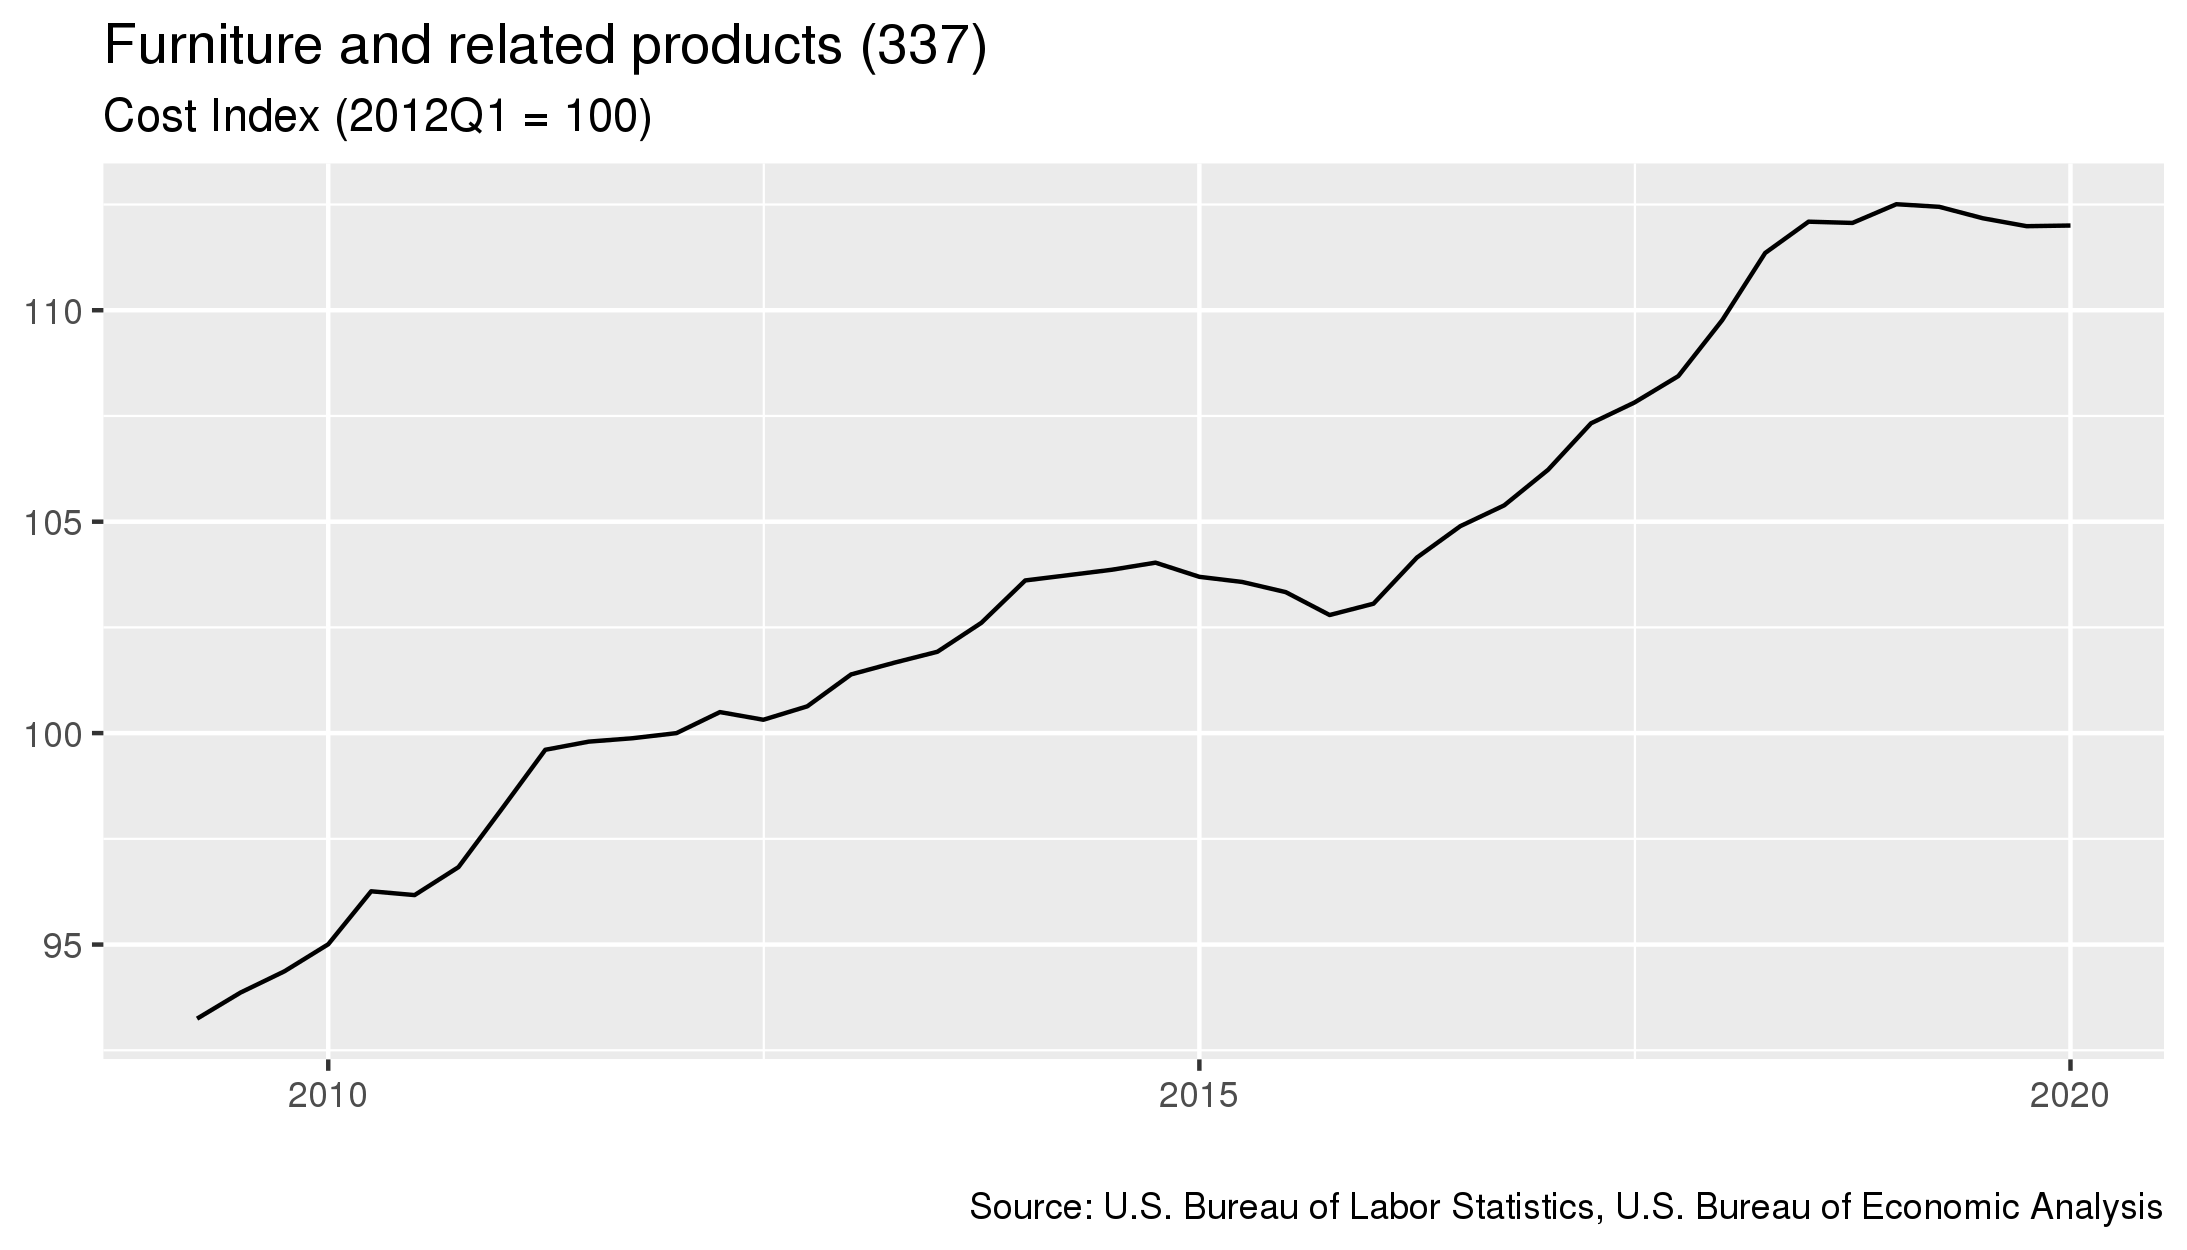
- As of January 2020, costs in this industry had increased 0 percent since the previous quarter.
- From January 2019 to January 2020 costs in this industry decreased 0.4 percent.
- Costs increased 8.7 percent in the five year period starting in January 2015 and ending in January 2020.
For details on which industries are included in each sector, click here
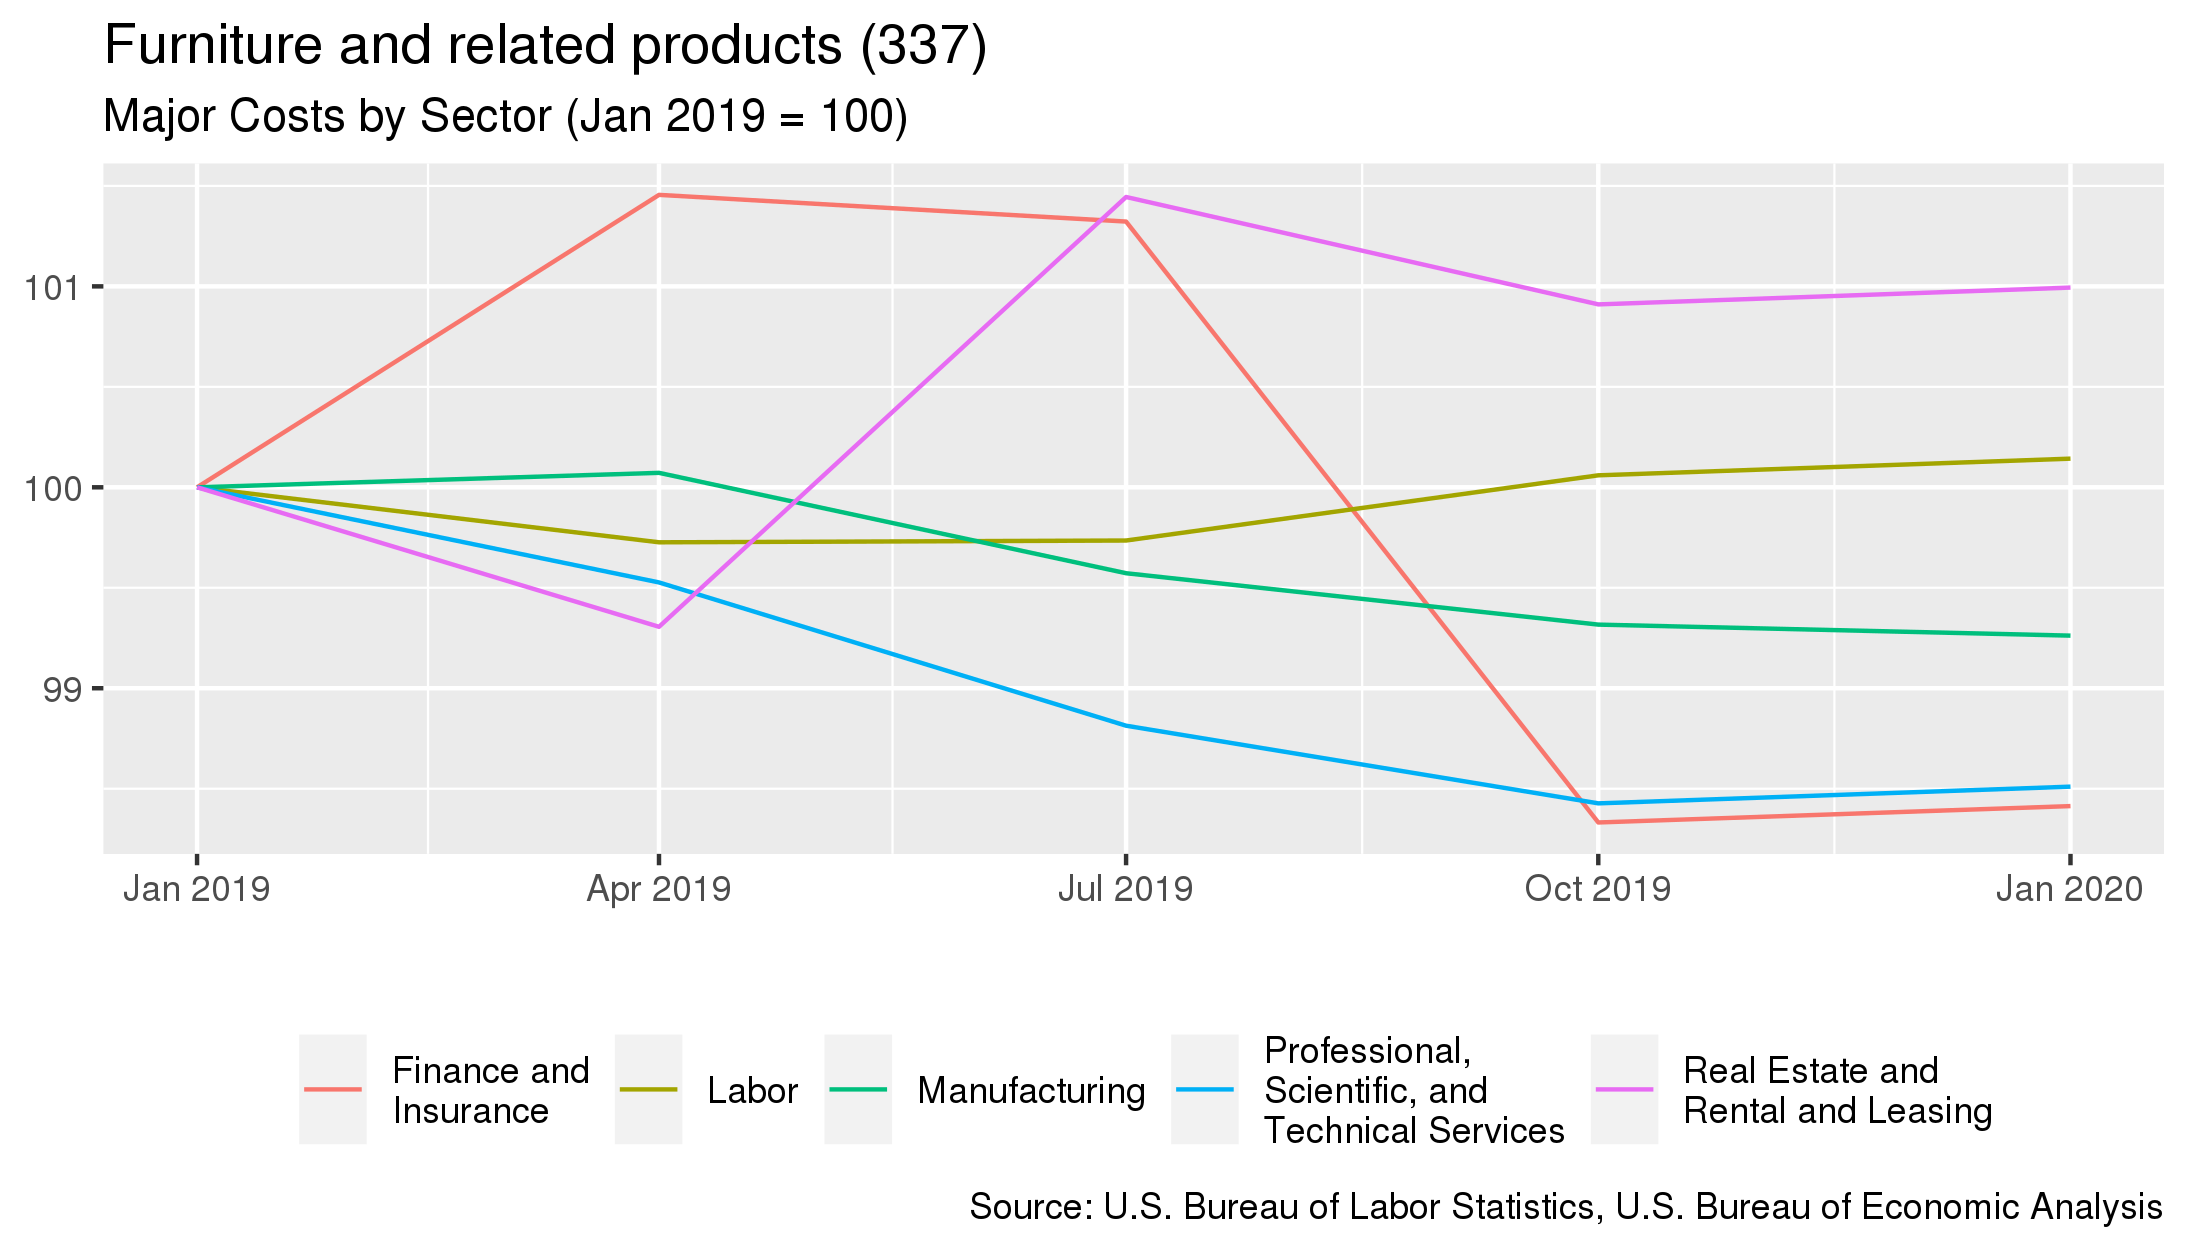
- The largest cost for this industry is purchases made to the Manufacturing sector. This sector accounts for 54.1% of the industry's overall costs.
- From January 2019 to January 2020, the largest change in costs for this industry were costs associated with purchases to the Finance and Insurance sector. Costs associated with this sector decreased -1.6%.
| Sector Name | Percentage of Costs | Annual Percent Change 4 |
|---|---|---|
| Manufacturing | 54.1% | -0.7% |
| Labor | 32.4% | +0.1% |
| Professional, Scientific, and Technical Services | 4.1% | -1.5% |
| Real Estate and Rental and Leasing | 1.8% | +1% |
| Finance and Insurance | 1.7% | -1.6% |
To download this data, or to learn more about how demand for this industry is measured, please contact us.
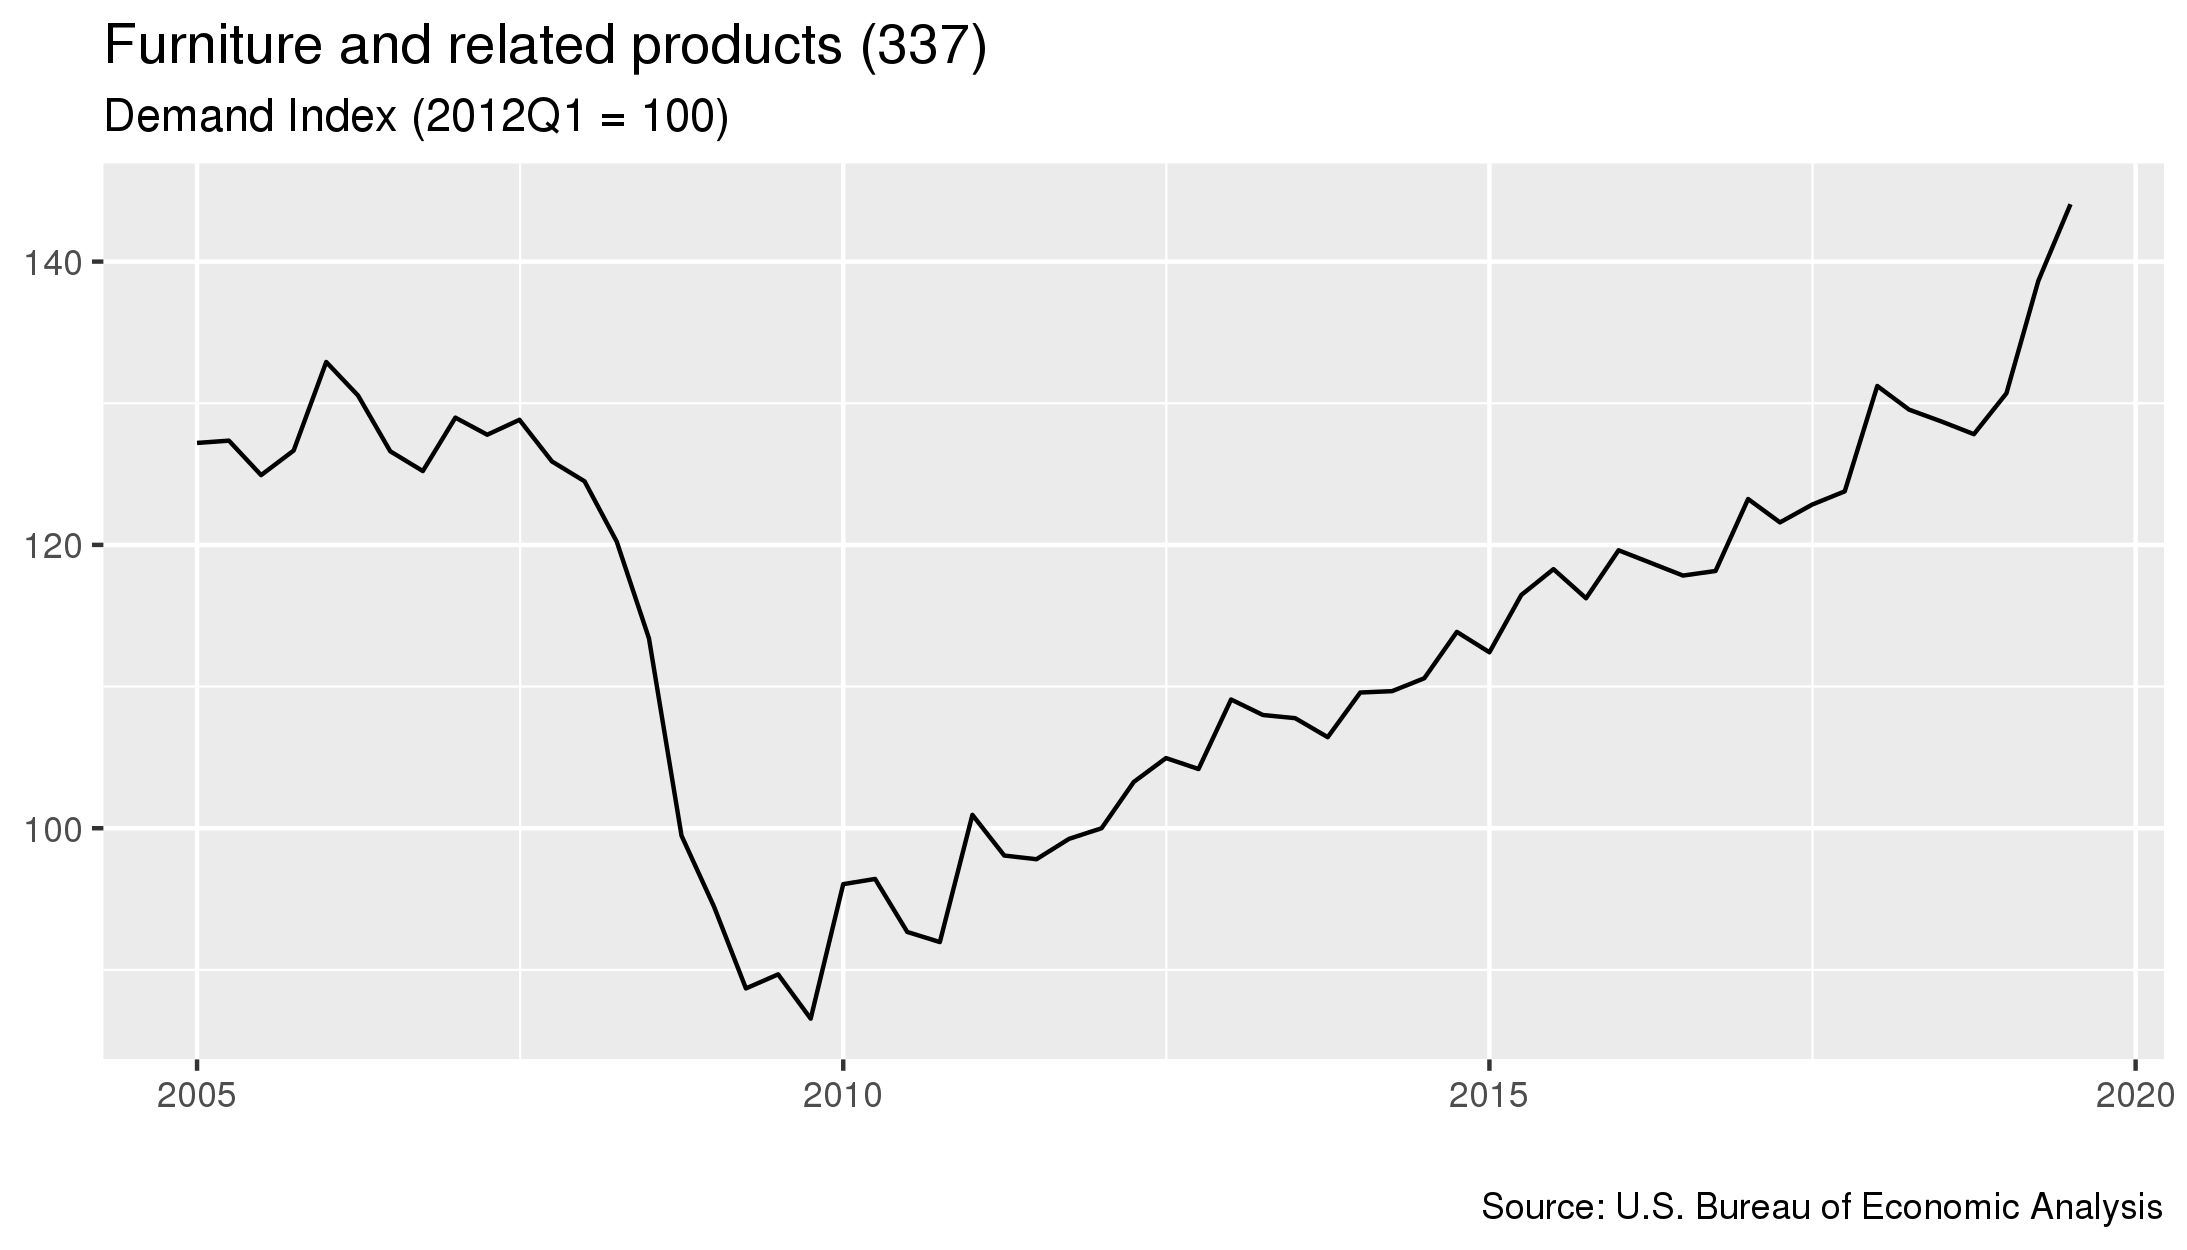
- As of July 2019, demand for this industry had increased 3.9 percent since the previous quarter.
- From July 2018 to January 2020 costs in this industry increased 11.9 percent.
- Costs increased 21.8 percent in the five year period starting in July 2014 and ending in July 2019.
For details on which industries are included in each sector, click here
- The sector that contributes the most to this industry's demand is the Personal consumption sector. This sector accounts for 50% of the industry's overall demand.
- From January 2019 to January 2020, the largest change in demand for this industry was from the Private fixed investment sector, where demand increased 45.2%.
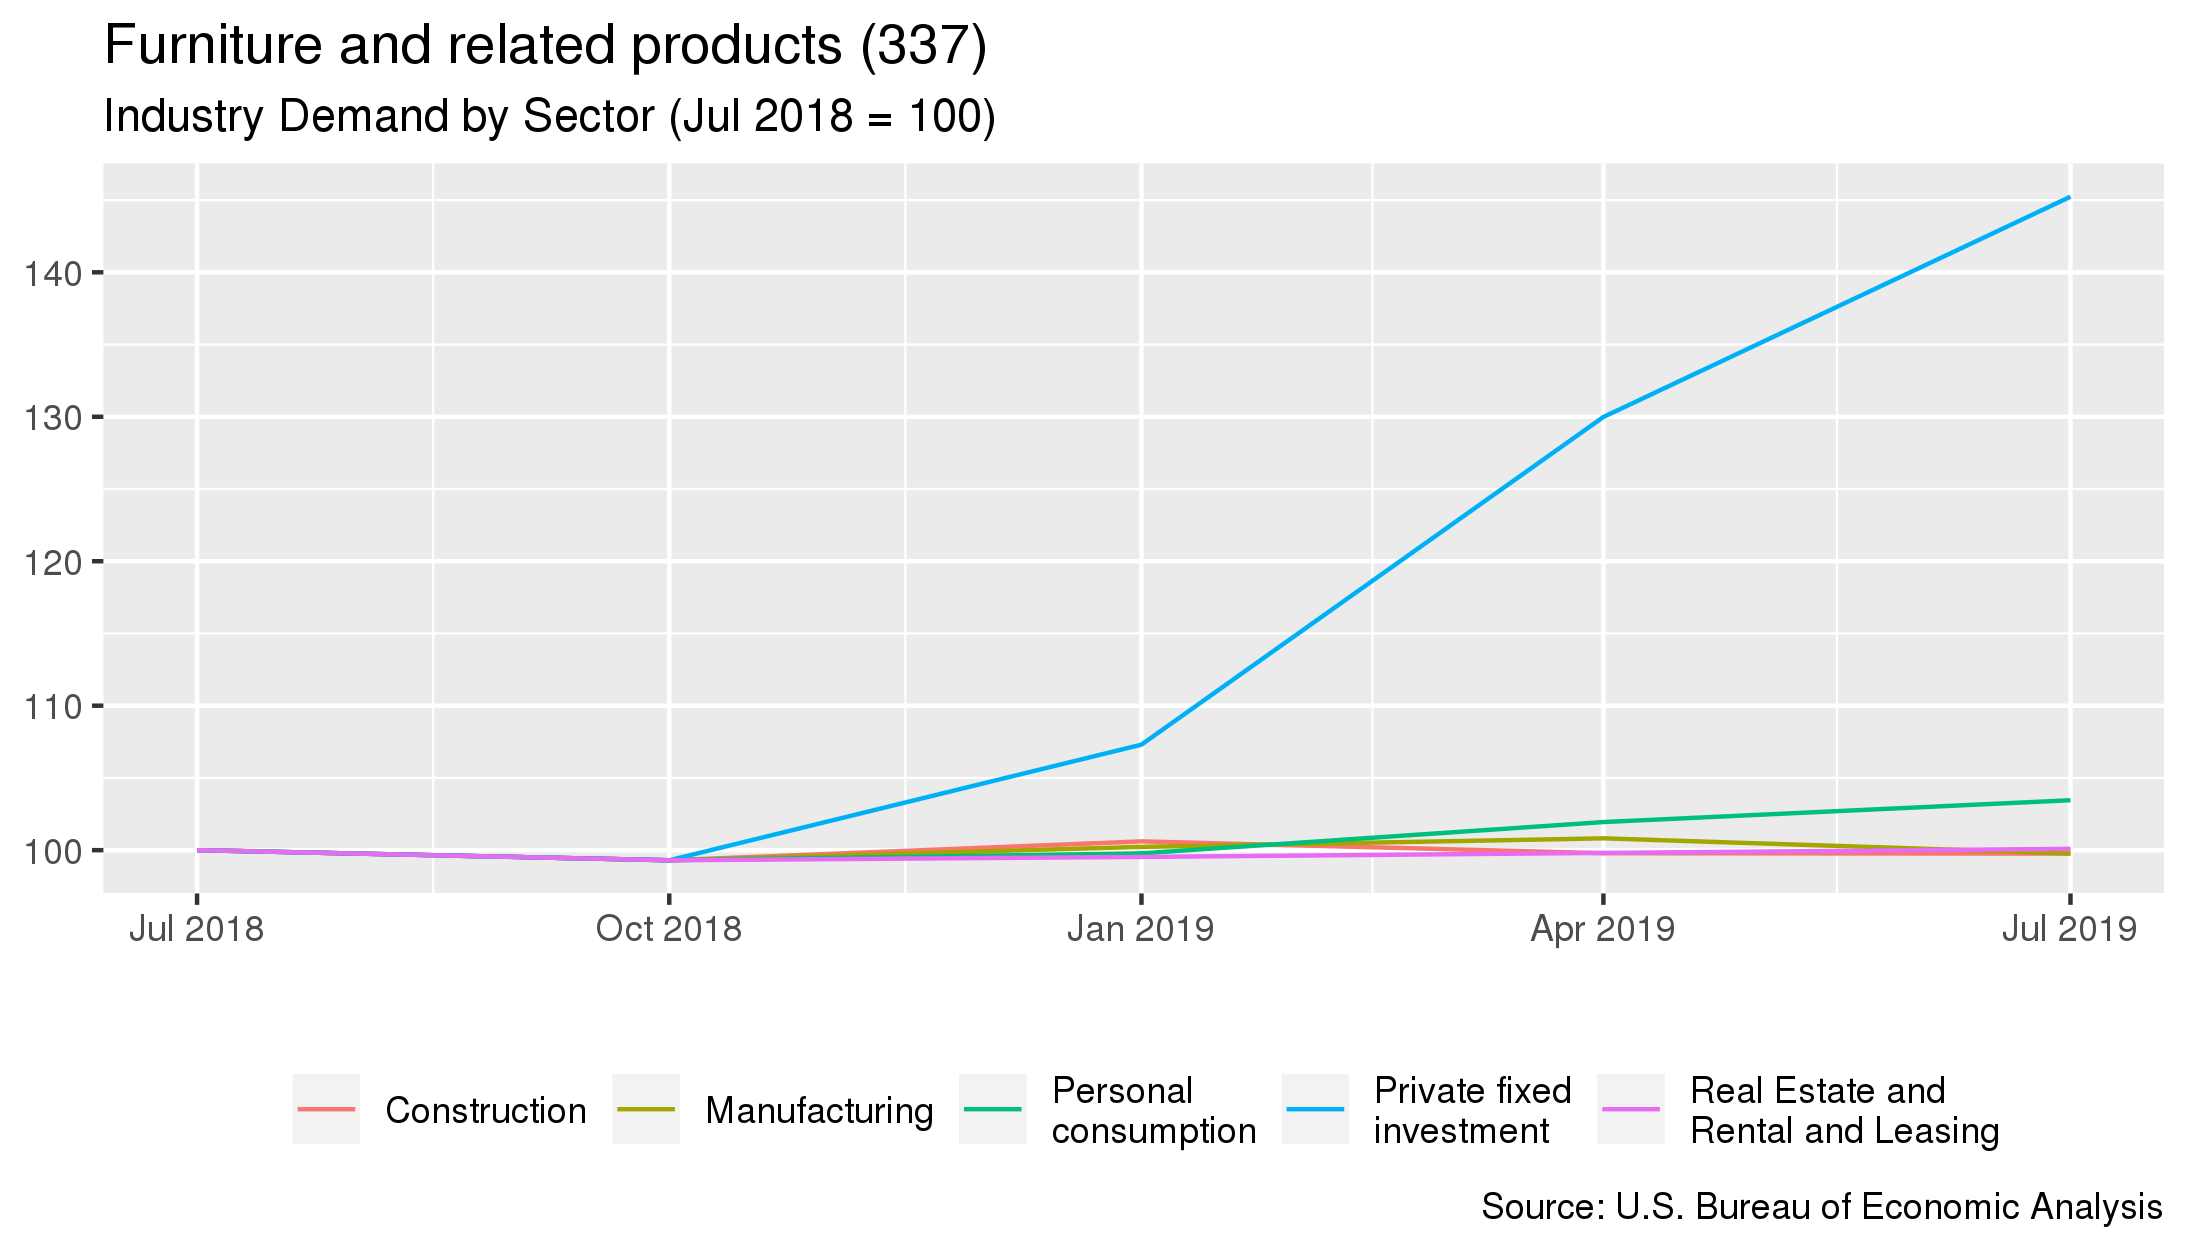
| Sector Name | Percentage of Demand | Annual Percent Change 6 |
|---|---|---|
| Personal consumption | 50% | +3.5% |
| Private fixed investment | 26% | +45.2% |
| Construction | 10.7% | -0.2% |
| Real Estate and Rental and Leasing | 4.6% | +0.1% |
| Manufacturing | 2.8% | -0.2% |
- Pricing measured from January 2020.
- The BLS PPI used for this industry is PCU337---337---.
- Costs measured from January 2020
- Demand measured from July 2019