Air transportation
Industry profile, February 2020
Sections: Description | Pricing | Costs | Demand | Appendix
This page is an industry profile for the Air transportation industry. It provides a general economic overview of recent developments in the industry. This includes information on industry pricing, costs, and demand. Below you will find a description of what type of business establishments are included in this industry. For information on how to best utilize this industry profile please visit our Business Solutions.
Industry Description
Industries in the Air Transportation subsector provide air transportation of passengers and/or cargo using aircraft, such as airplanes and helicopters. The subsector distinguishes scheduled from nonscheduled air transportation. Scheduled air carriers fly regular routes on regular schedules and operate even if flights are only partially loaded. Nonscheduled carriers often operate during nonpeak time slots at busy airports. These establishments have more flexibility with respect to choice of airport, hours of operation, load factors, and similar operational characteristics. Nonscheduled carriers provide chartered air transportation of passengers, cargo, or specialty flying services. Specialty flying services establishments use general purpose aircraft to provide a variety of specialized flying services.
This industry description was sourced from the North American Industry Classification System.
To download this data, or to learn more about how pricing is measured, please contact us.
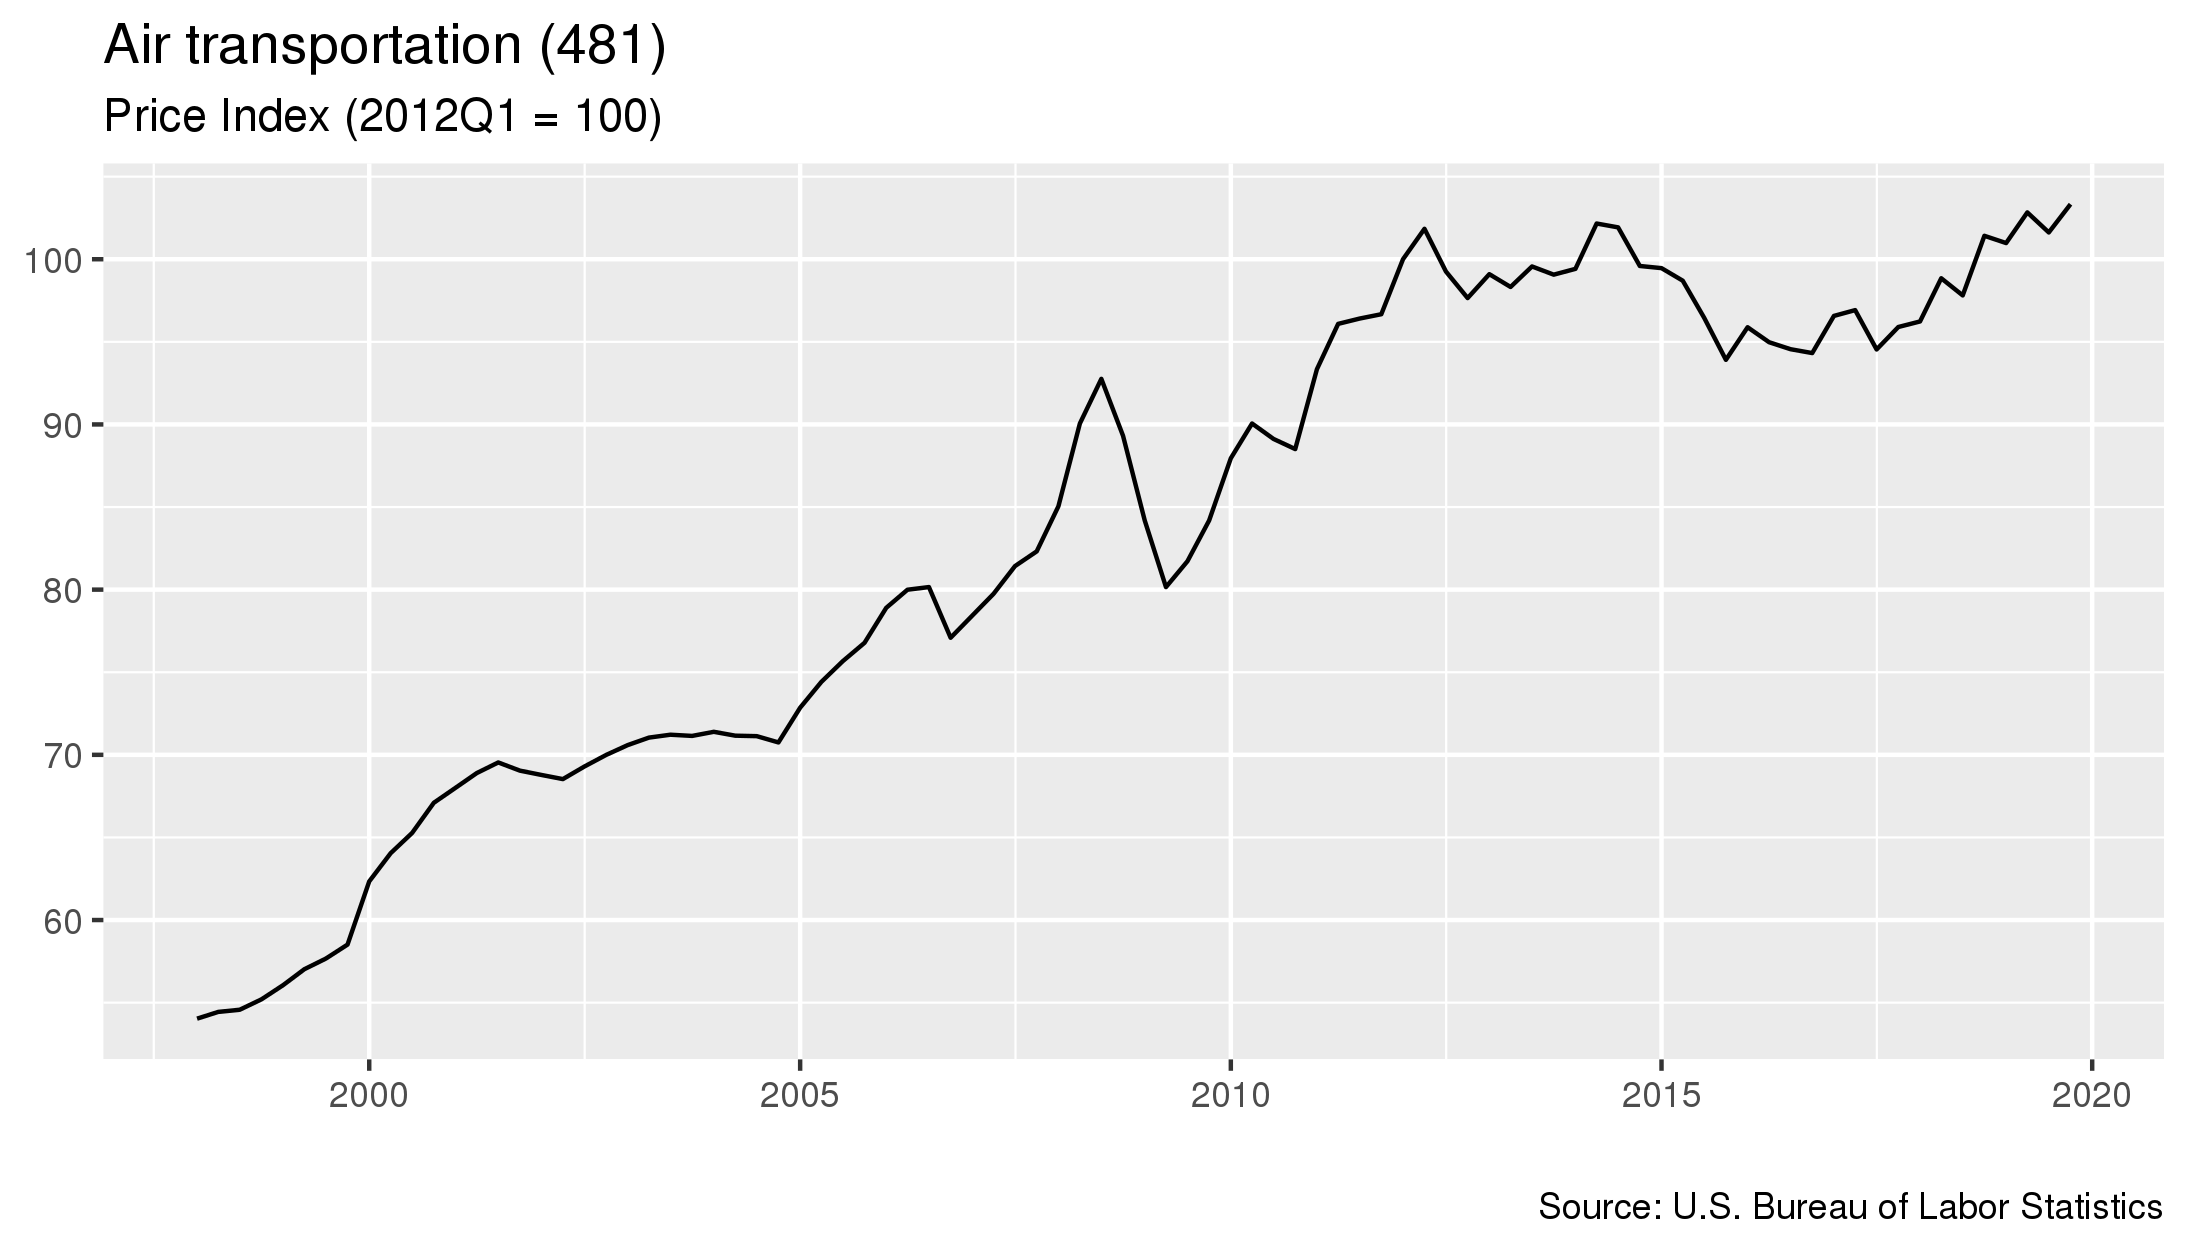
- As of January 2020, prices in this industry had increased 1.7 percent since the previous quarter.
- From January 2019 to January 2020 prices in this industry increased 1.9 percent.
- Prices increased 10 percent in the five year period starting in January 2015 and ending in January 2020.
To download this data, or to learn more about how costs for this industry are measured, please contact us.
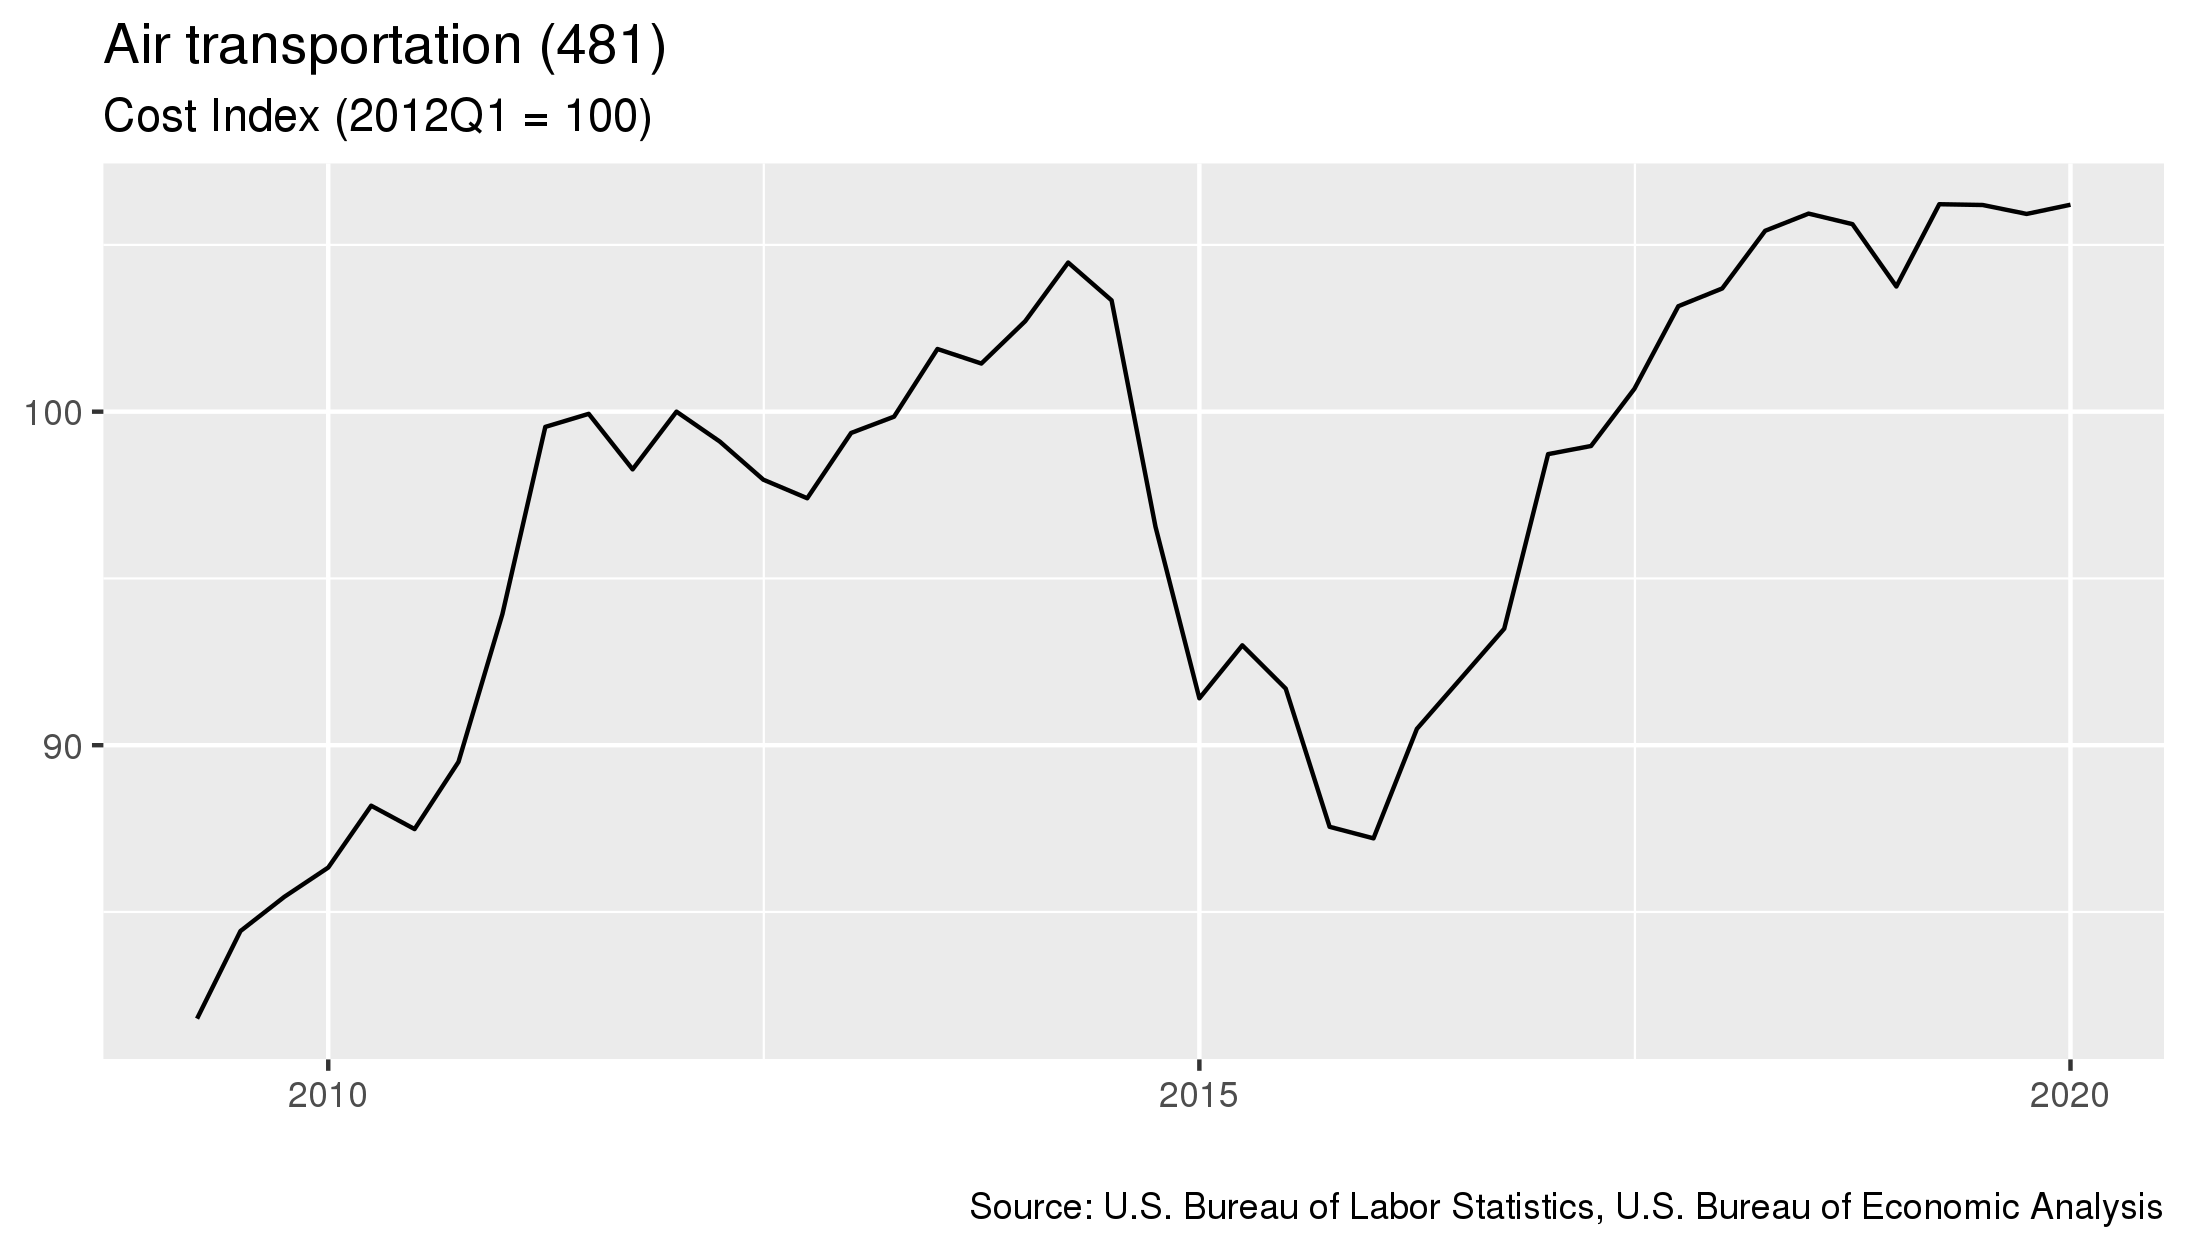
- As of January 2020, costs in this industry had increased 0.3 percent since the previous quarter.
- From January 2019 to January 2020 costs in this industry increased 2.4 percent.
- Costs increased 21.8 percent in the five year period starting in January 2015 and ending in January 2020.
For details on which industries are included in each sector, click here
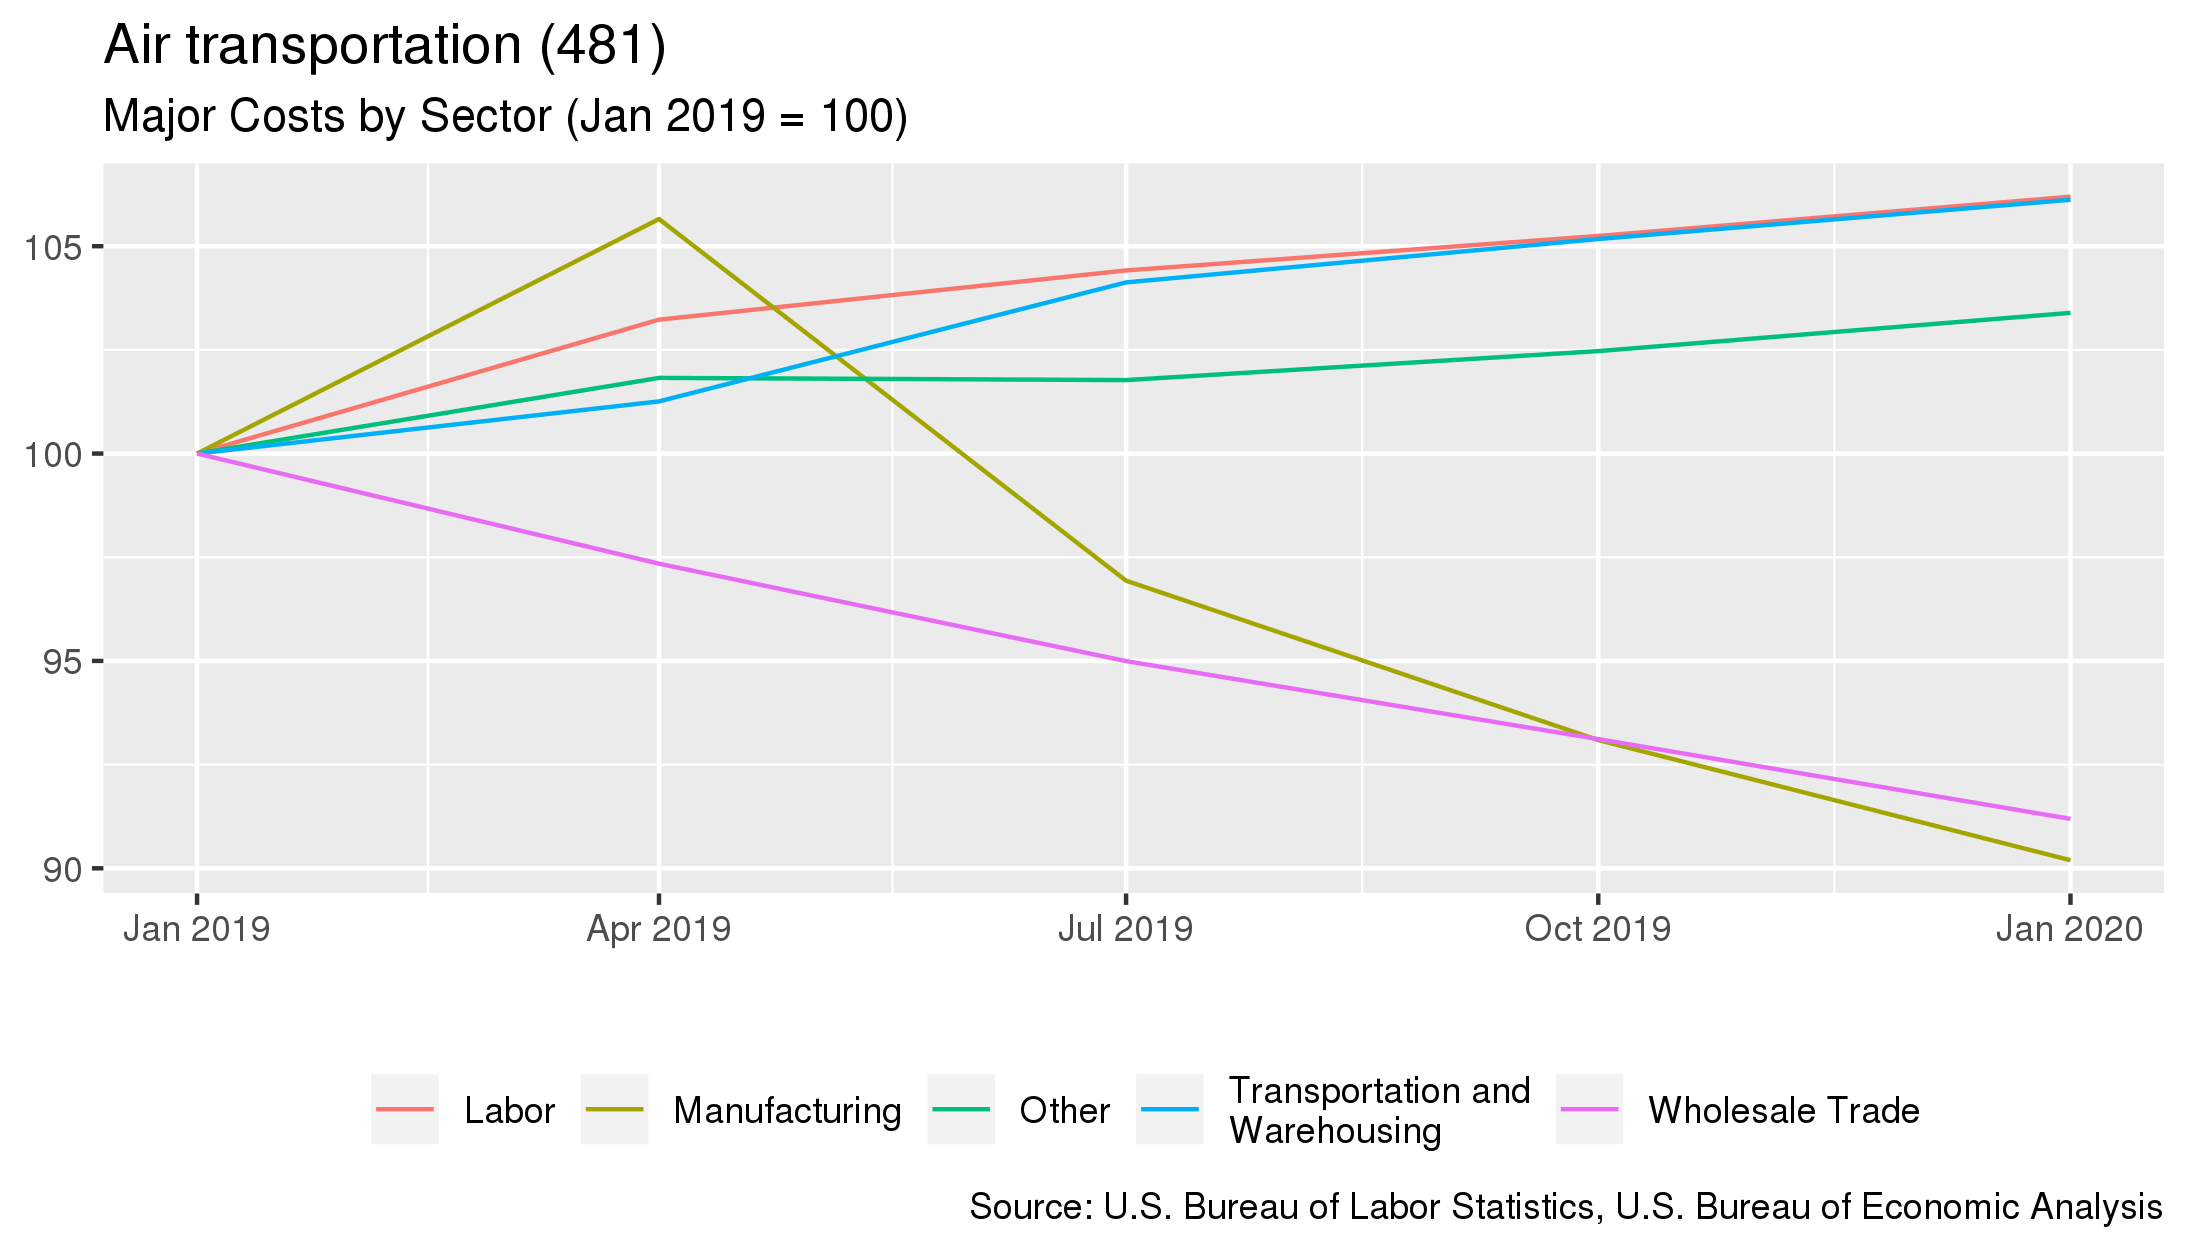
- The largest cost for this industry is purchases made to the Labor sector. This sector accounts for 40.9% of the industry's overall costs.
- From January 2019 to January 2020, the largest change in costs for this industry were costs associated with purchases to the Manufacturing sector. Costs associated with this sector decreased -9.8%.
| Sector Name | Percentage of Costs | Annual Percent Change 4 |
|---|---|---|
| Labor | 40.9% | +6.2% |
| Transportation and Warehousing | 12.9% | +6.1% |
| Other | 10.5% | +3.4% |
| Manufacturing | 9.7% | -9.8% |
| Wholesale Trade | 7.6% | -8.8% |
To download this data, or to learn more about how demand for this industry is measured, please contact us.
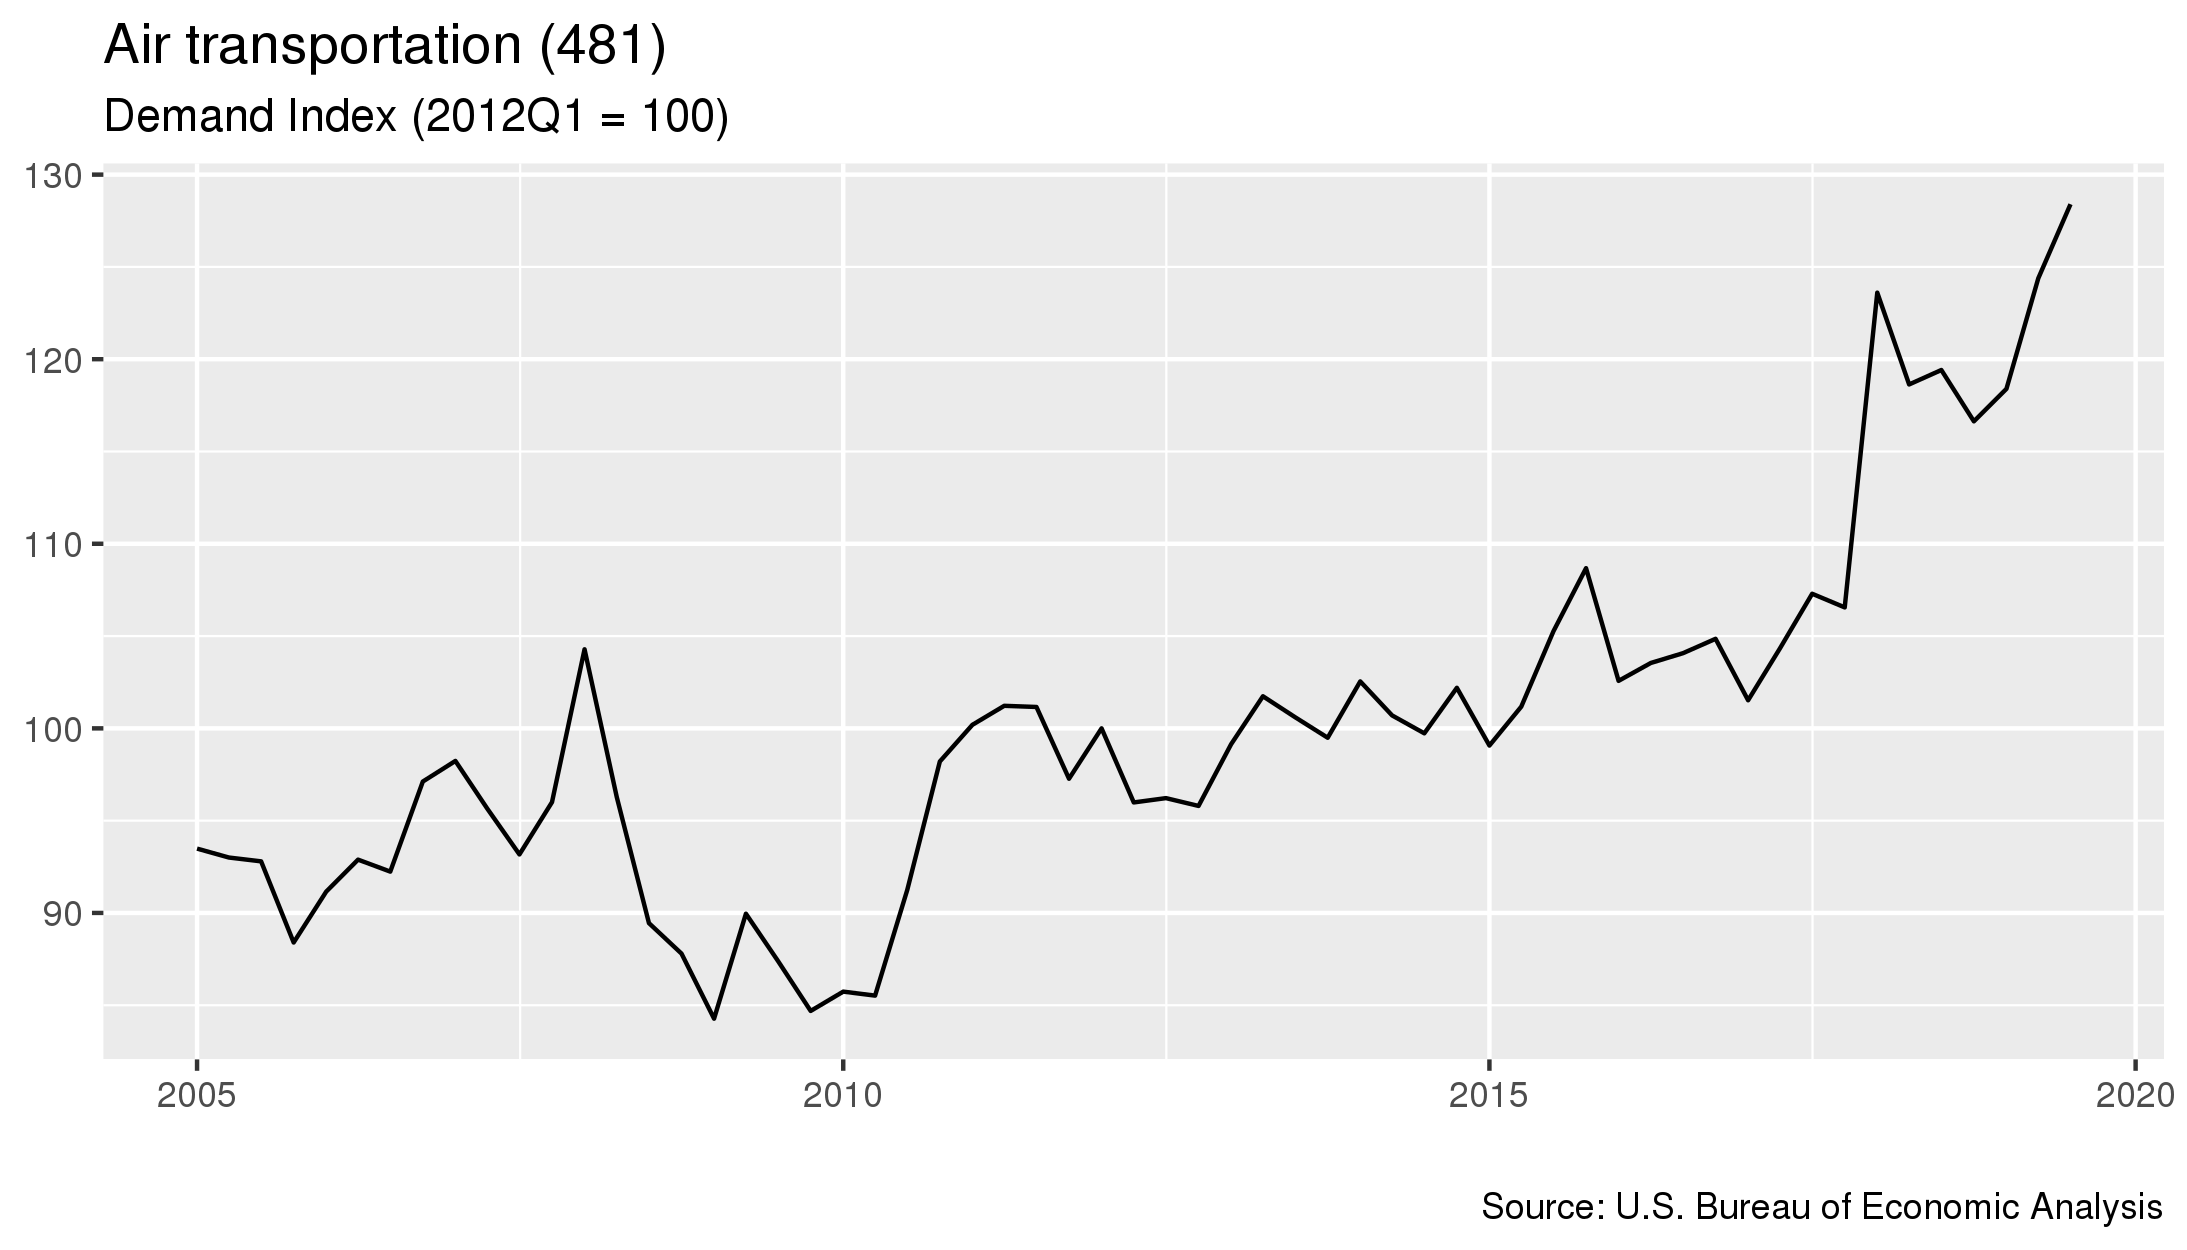
- As of July 2019, demand for this industry had increased 3.2 percent since the previous quarter.
- From July 2018 to January 2020 costs in this industry increased 7.5 percent.
- Costs increased 22 percent in the five year period starting in July 2014 and ending in July 2019.
For details on which industries are included in each sector, click here
- The sector that contributes the most to this industry's demand is the Personal consumption sector. This sector accounts for 47.9% of the industry's overall demand.
- From January 2019 to January 2020, the largest change in demand for this industry was from the Exports sector, where demand increased 42.9%.
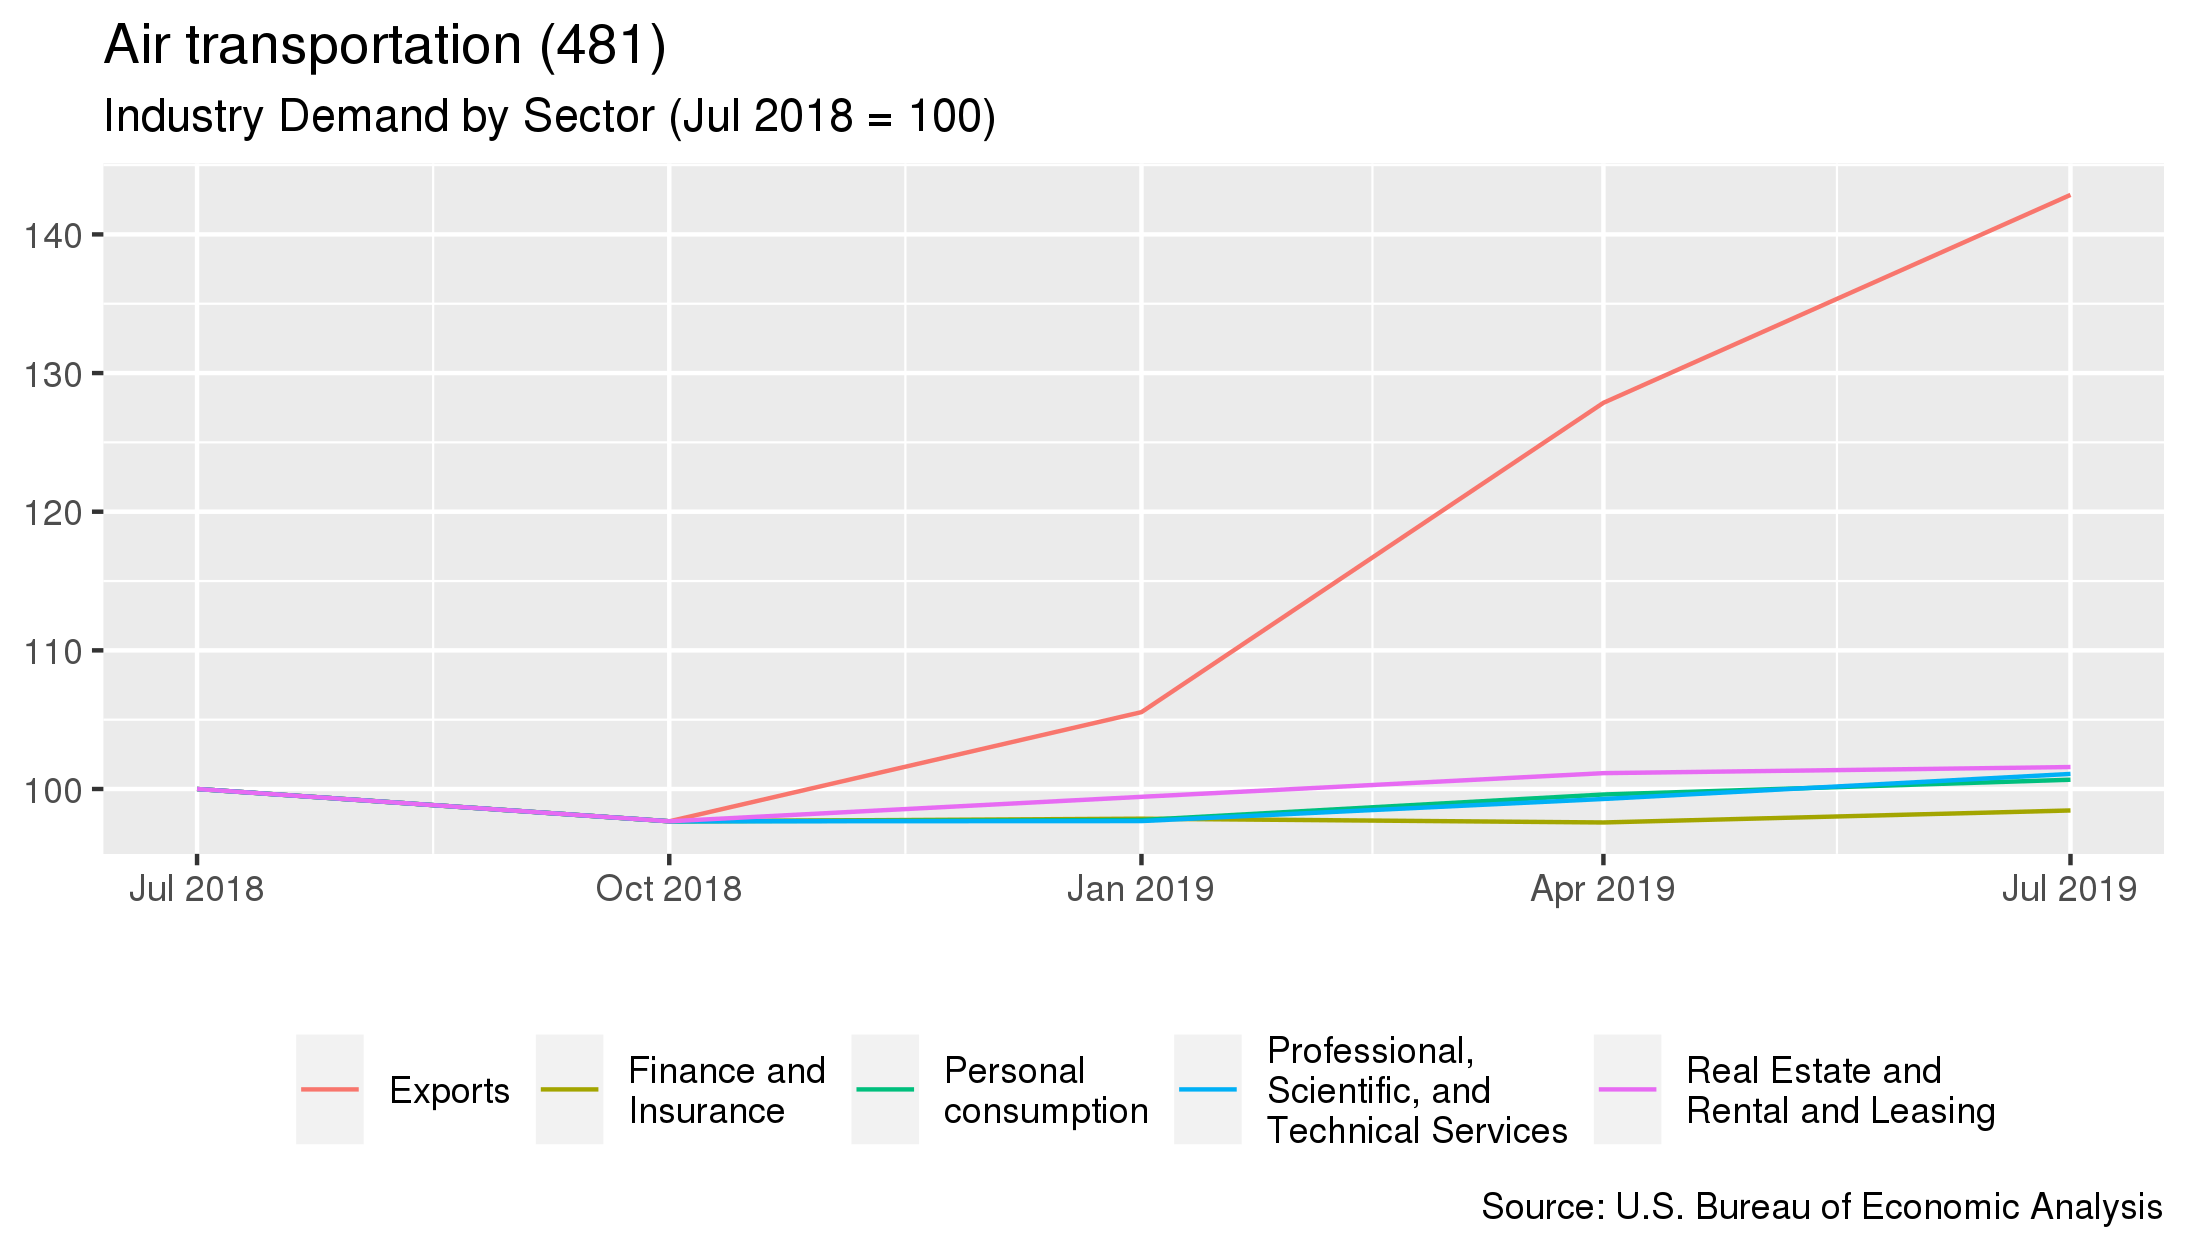
| Sector Name | Percentage of Demand | Annual Percent Change 6 |
|---|---|---|
| Personal consumption | 47.9% | +0.7% |
| Exports | 23.1% | +42.9% |
| Professional, Scientific, and Technical Services | 4% | +1.1% |
| Real Estate and Rental and Leasing | 3.7% | +1.6% |
| Finance and Insurance | 3.6% | -1.5% |
- Pricing measured from January 2020.
- The BLS PPI used for this industry is PCU481---481---.
- Costs measured from January 2020
- Demand measured from July 2019