Other transportation and support activities
Industry profile, February 2020
Sections: Description | Pricing | Costs | Demand | Appendix
This page is an industry profile for the Other transportation and support activities industry. It provides a general economic overview of recent developments in the industry. This includes information on industry pricing, costs, and demand. Below you will find a description of what type of business establishments are included in this industry. For information on how to best utilize this industry profile please visit our Business Solutions.
Industry Description
Industries in the Scenic and Sightseeing Transportation subsector utilize transportation equipment to provide recreation and entertainment. These activities have a production process distinct from passenger transportation carried out for the purpose of other types of for-hire transportation. This process does not emphasize efficient transportation; in fact, such activities often use obsolete vehicles, such as steam trains, to provide some extra ambience. The activity is local in nature, usually involving a same-day return to the point of departure.
This industry description was sourced from the North American Industry Classification System.
To download this data, or to learn more about how pricing is measured, please contact us.
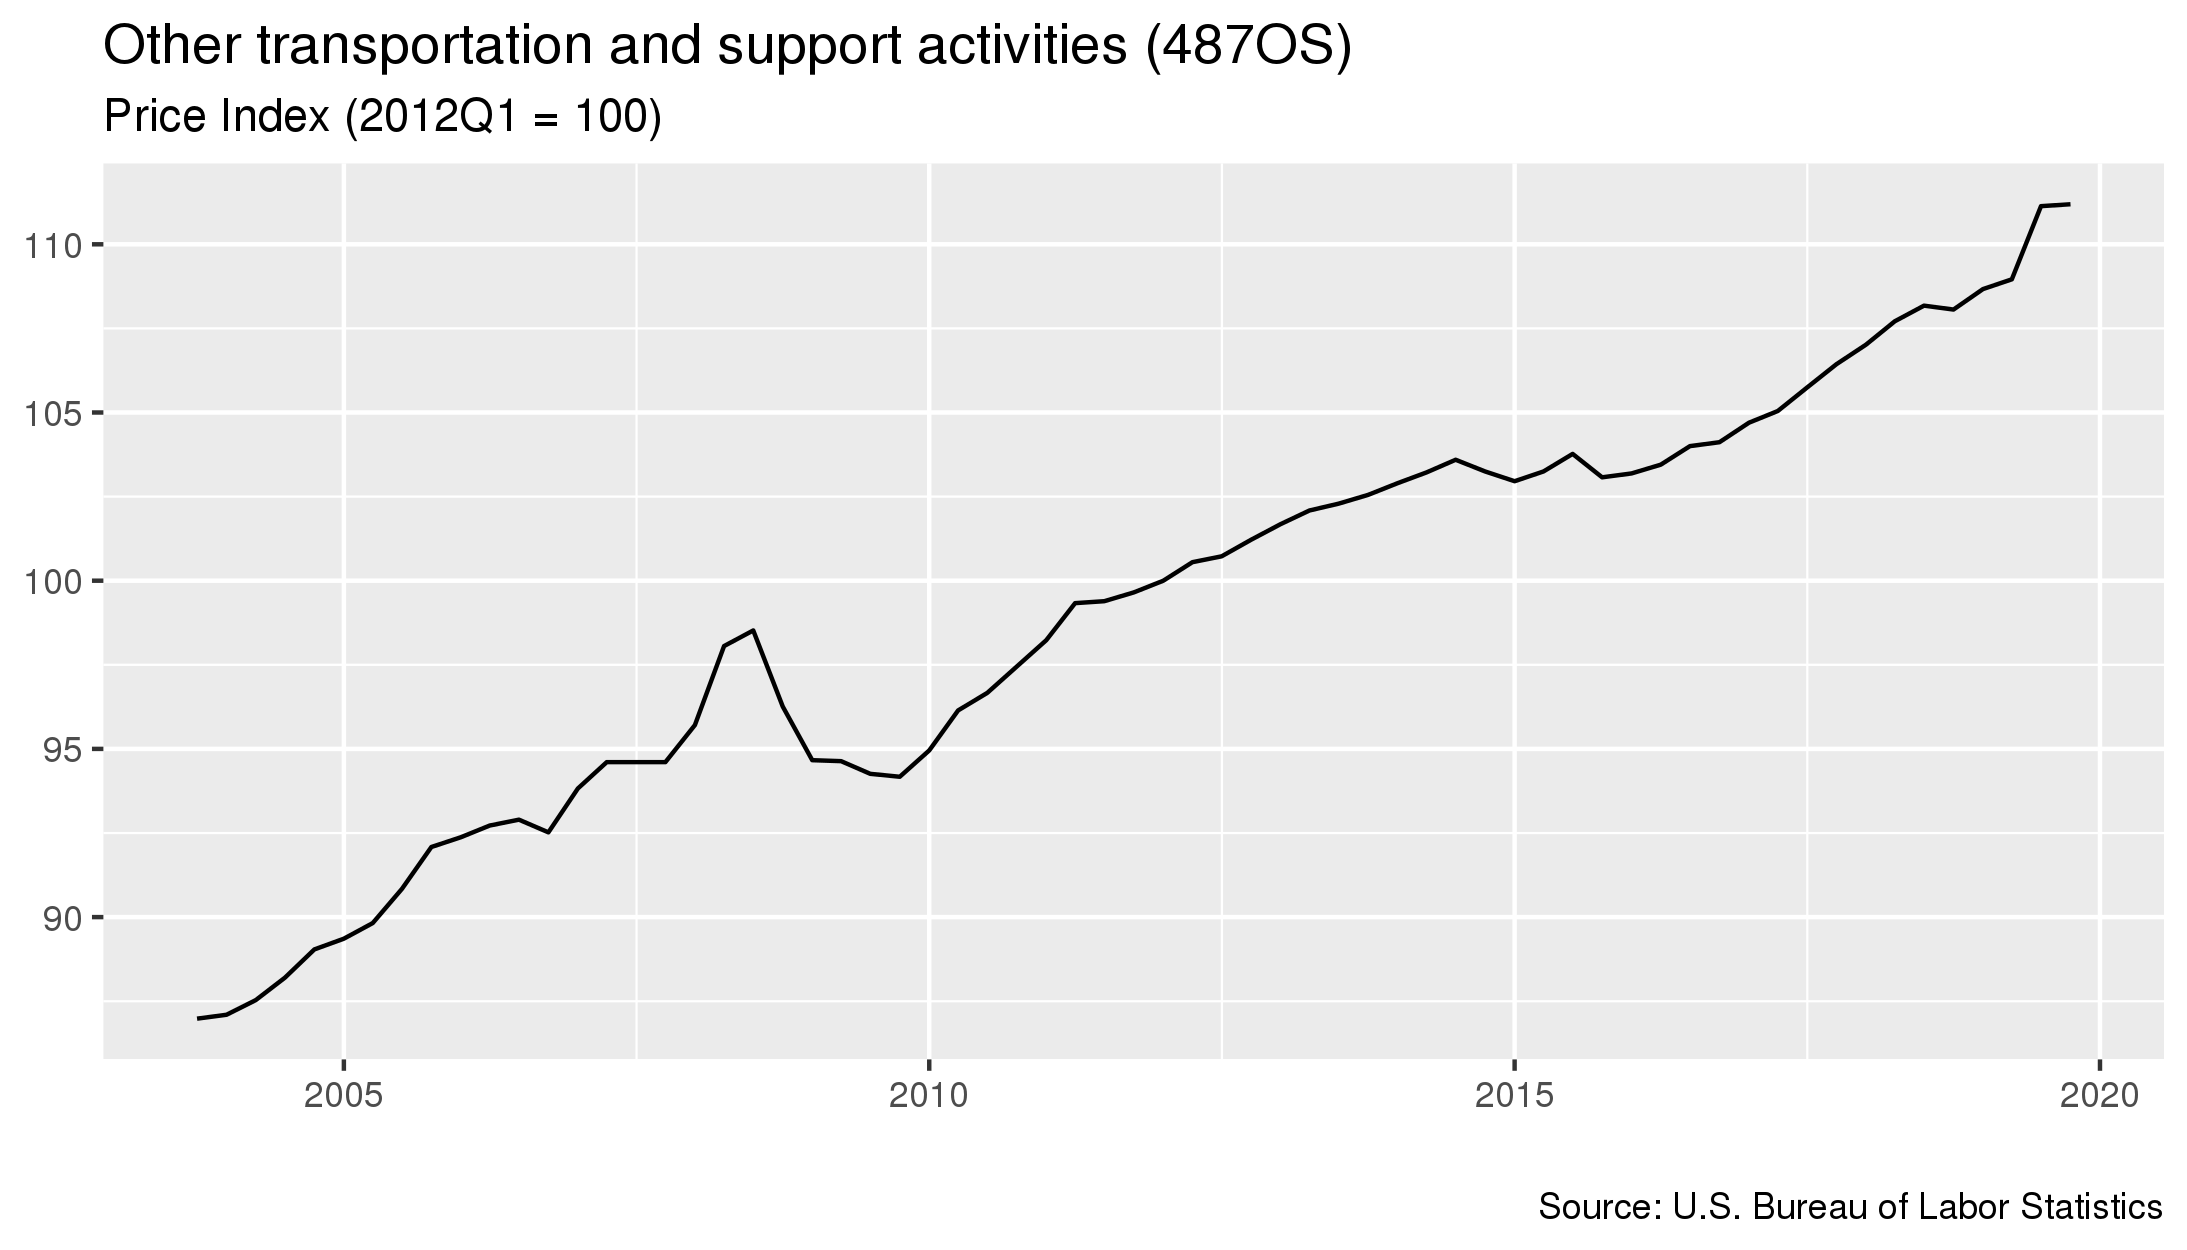
- As of January 2020, prices in this industry had increased 0.1 percent since the previous quarter.
- From January 2019 to January 2020 prices in this industry increased 2.9 percent.
- Prices increased 7.9 percent in the five year period starting in January 2015 and ending in January 2020.
To download this data, or to learn more about how costs for this industry are measured, please contact us.
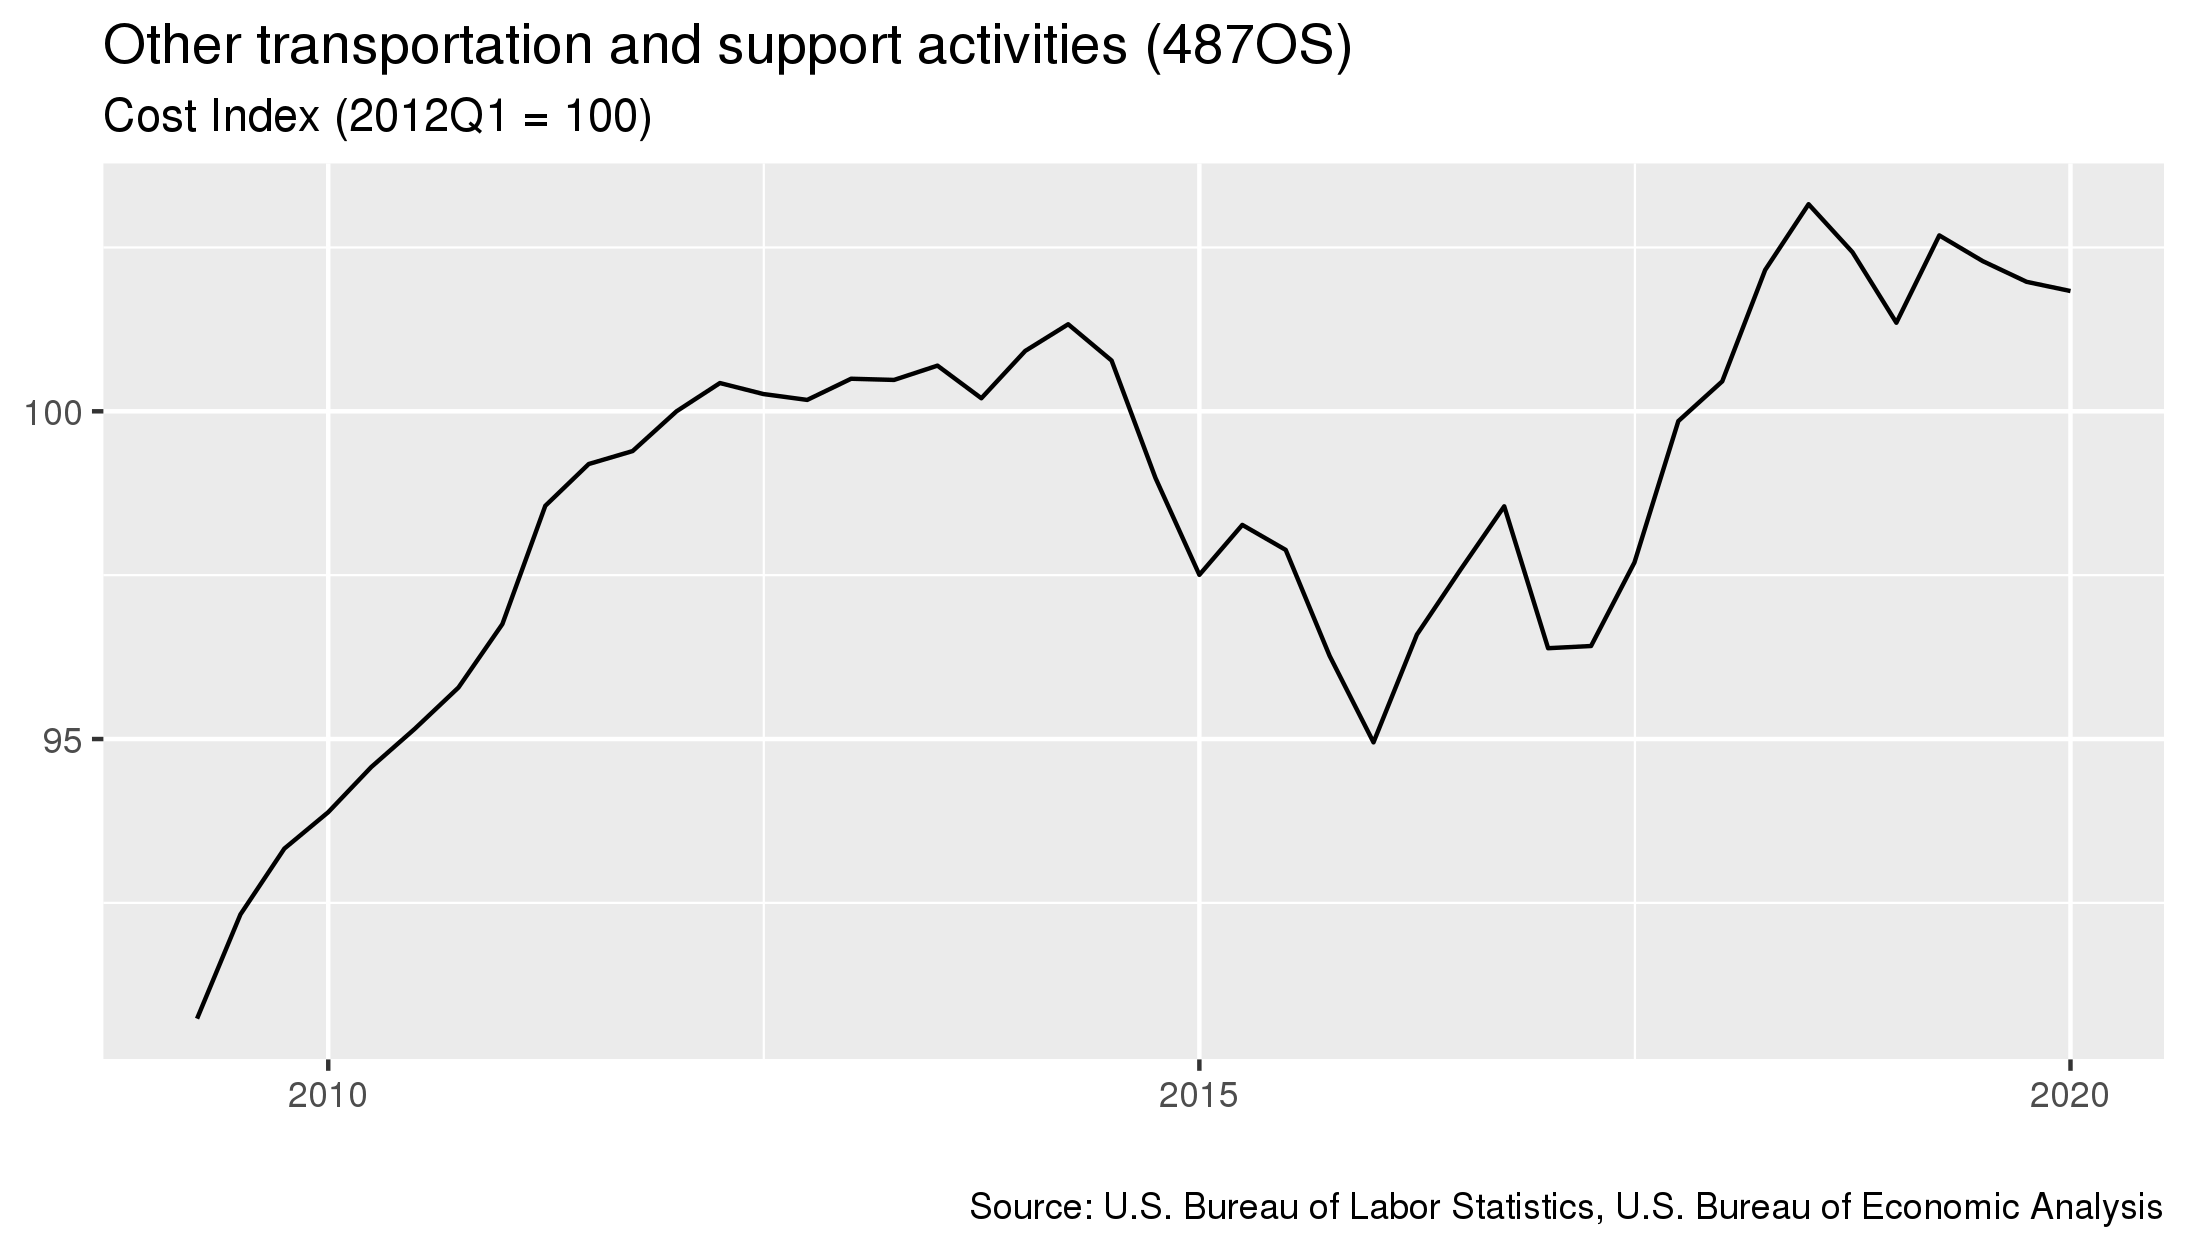
- As of January 2020, costs in this industry had decreased 0.1 percent since the previous quarter.
- From January 2019 to January 2020 costs in this industry increased 0.5 percent.
- Costs increased 7.3 percent in the five year period starting in January 2015 and ending in January 2020.
For details on which industries are included in each sector, click here
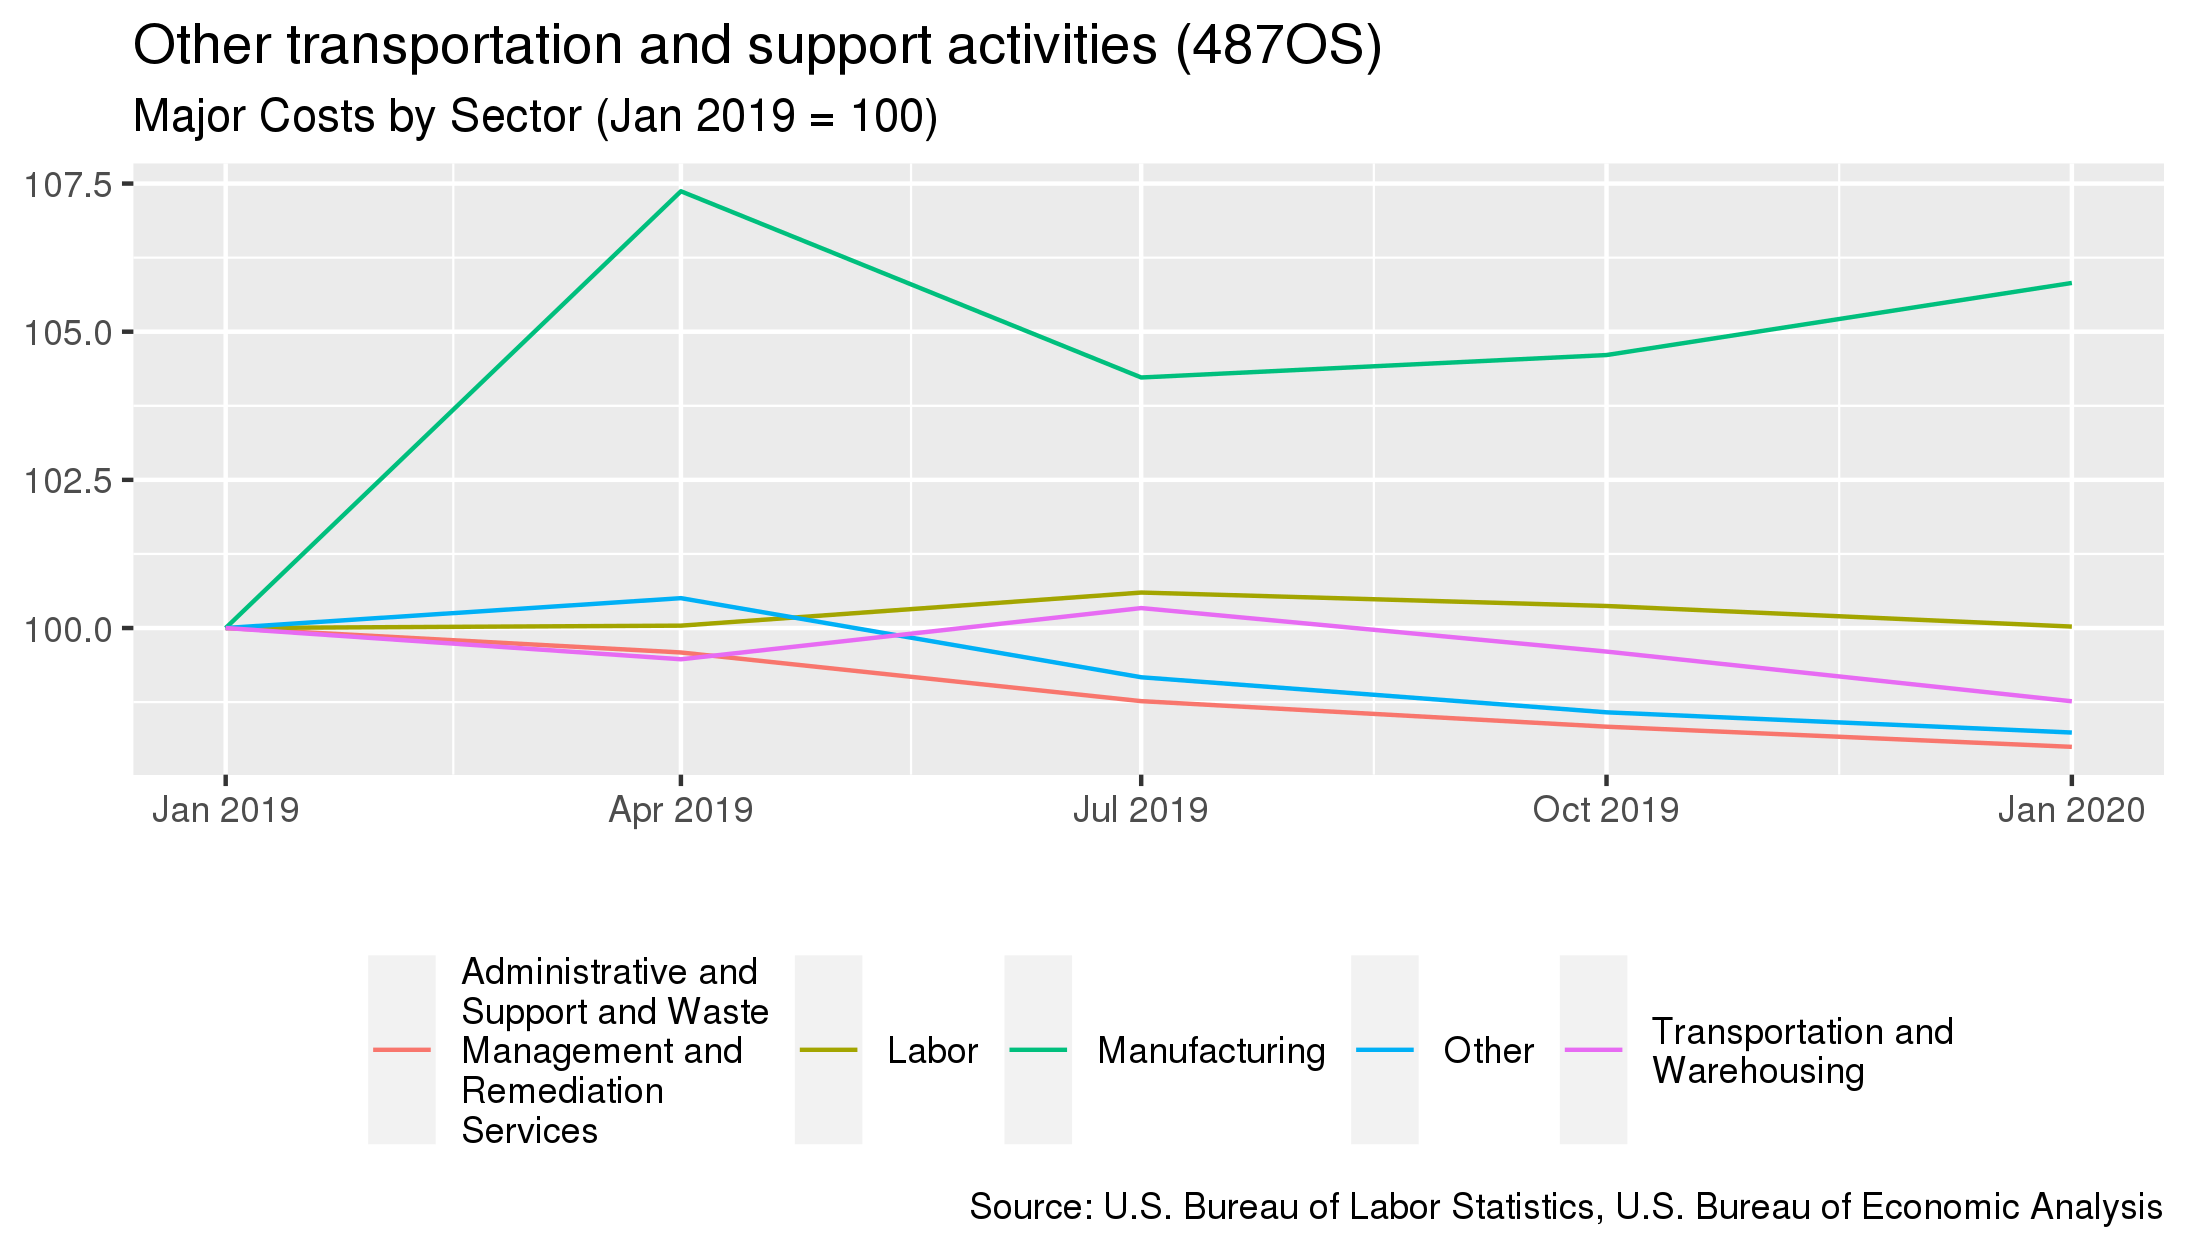
- The largest cost for this industry is purchases made to the Labor sector. This sector accounts for 43.7% of the industry's overall costs.
- From January 2019 to January 2020, the largest change in costs for this industry were costs associated with purchases to the Manufacturing sector. Costs associated with this sector increased 5.8%.
| Sector Name | Percentage of Costs | Annual Percent Change 4 |
|---|---|---|
| Labor | 43.7% | +0% |
| Manufacturing | 19.3% | +5.8% |
| Transportation and Warehousing | 15.3% | -1.2% |
| Administrative and Support and Waste Management and Remediation Services | 4.1% | -2% |
| Other | 3.2% | -1.8% |
To download this data, or to learn more about how demand for this industry is measured, please contact us.
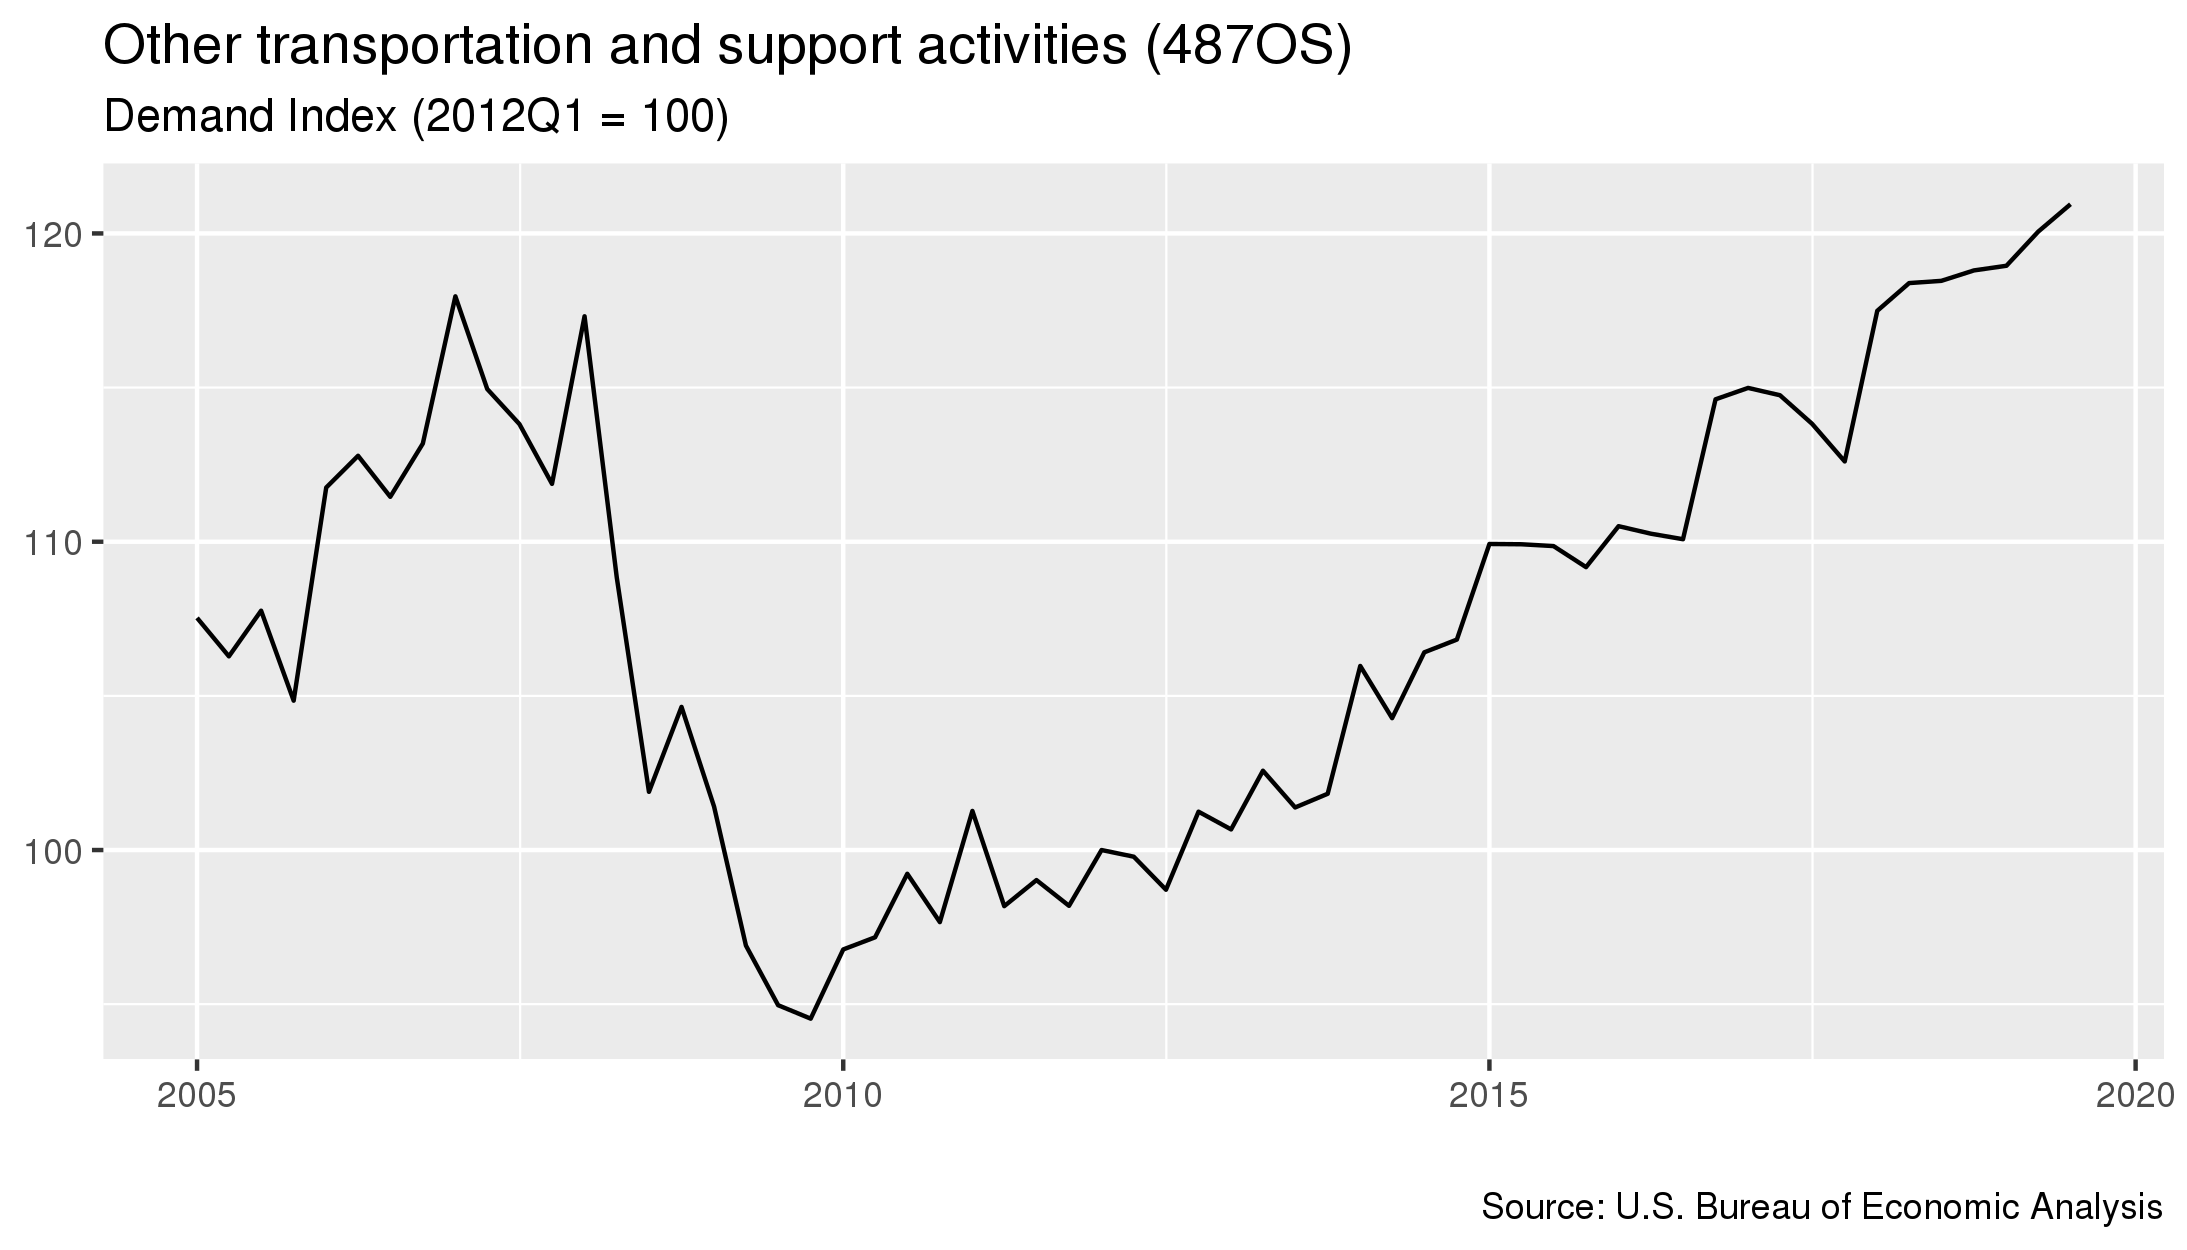
- As of July 2019, demand for this industry had increased 0.7 percent since the previous quarter.
- From July 2018 to January 2020 costs in this industry increased 2.1 percent.
- Costs increased 10.1 percent in the five year period starting in July 2014 and ending in July 2019.
For details on which industries are included in each sector, click here
- The sector that contributes the most to this industry's demand is the Transportation and Warehousing sector. This sector accounts for 36.7% of the industry's overall demand.
- From January 2019 to January 2020, the largest change in demand for this industry was from the Exports sector, where demand increased 46.7%.
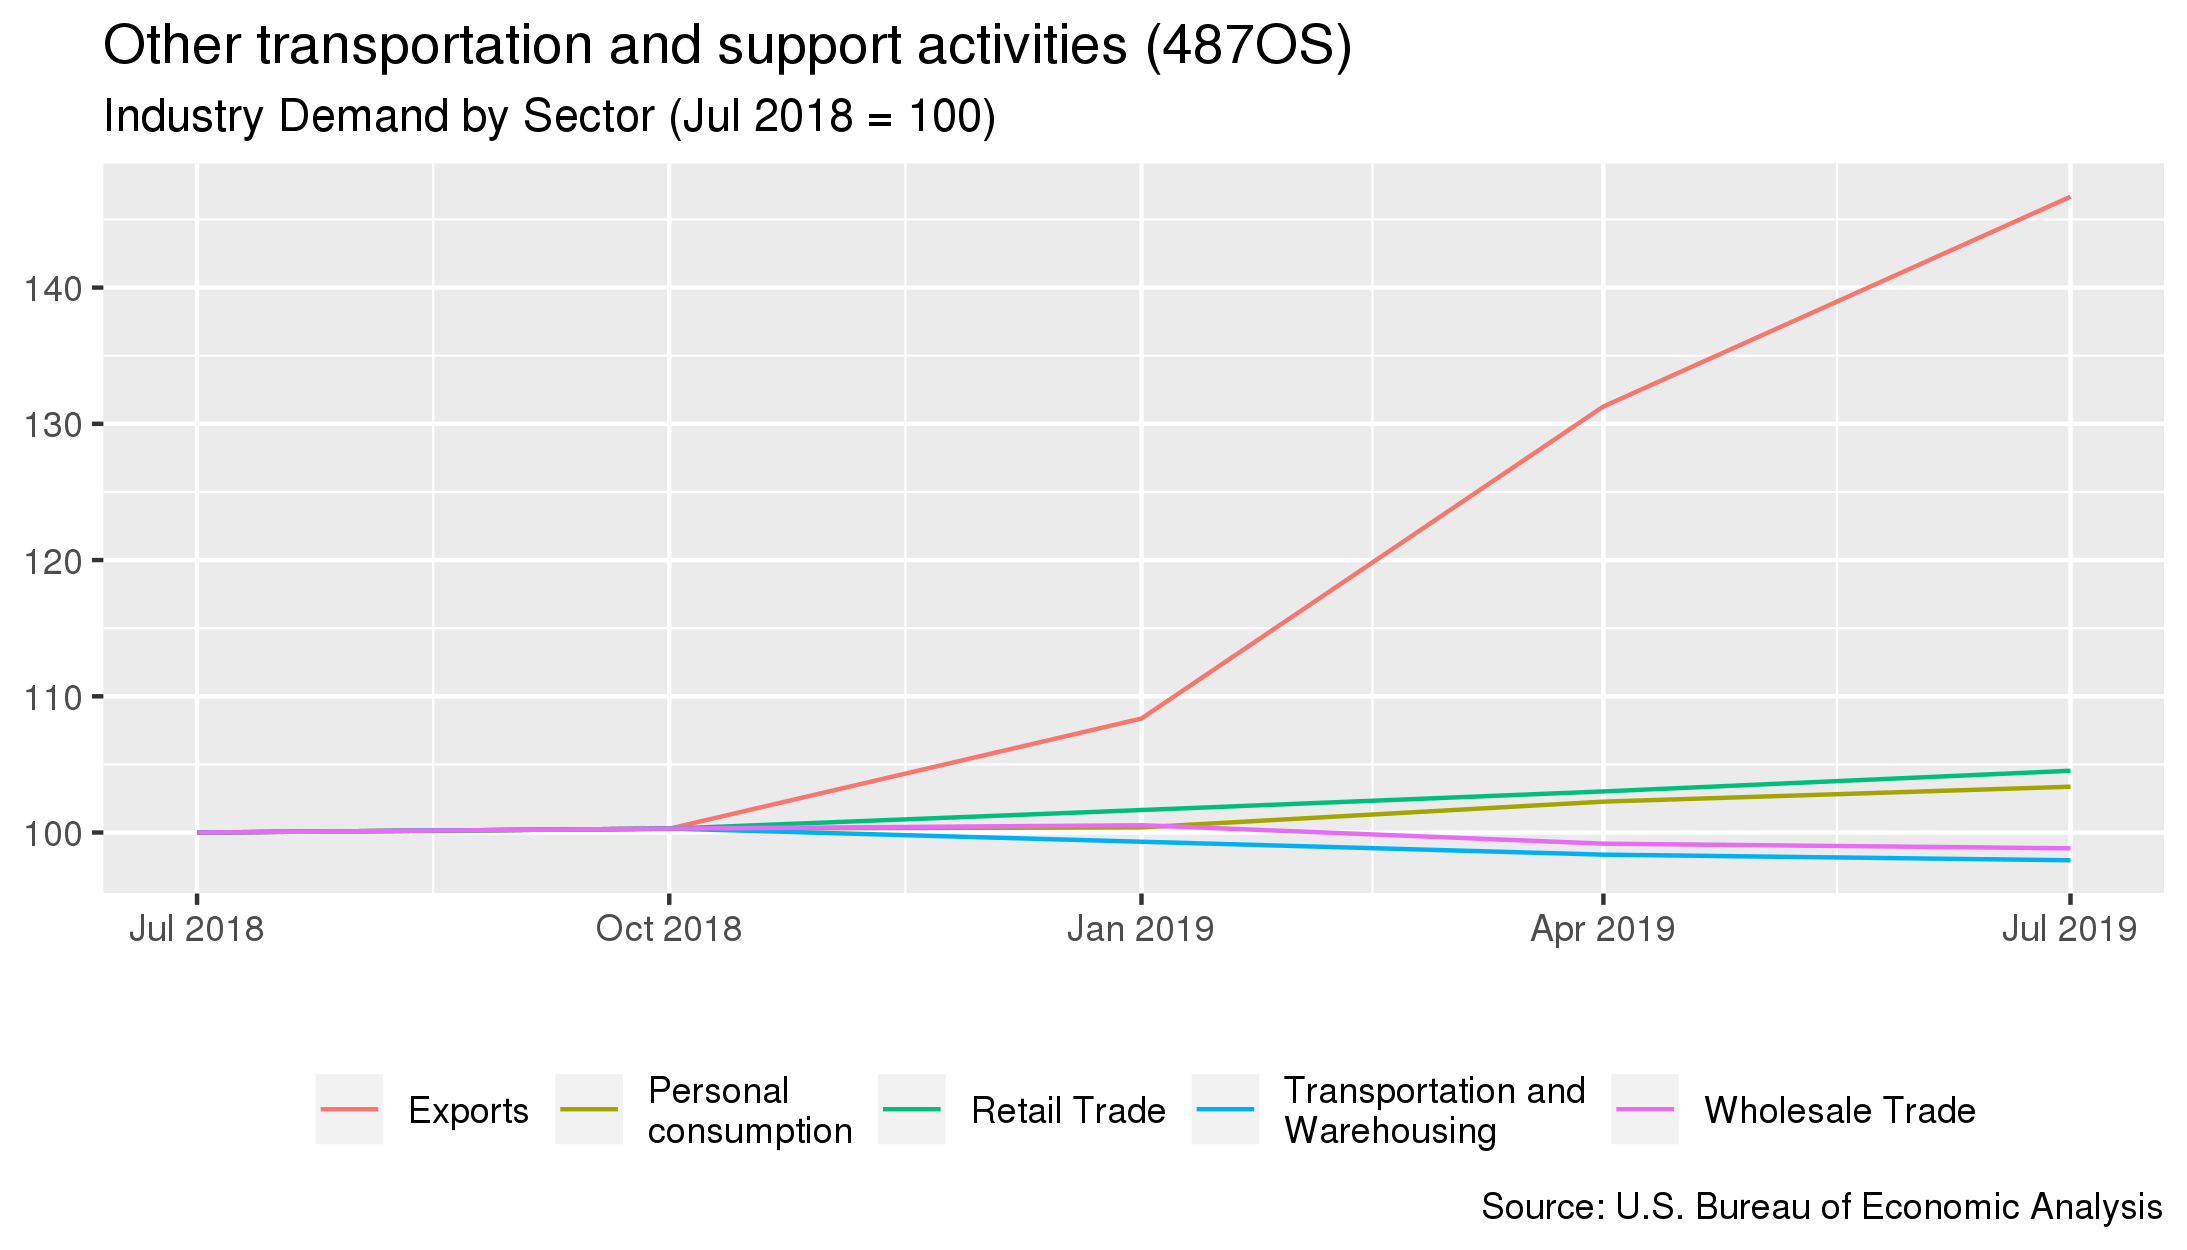
| Sector Name | Percentage of Demand | Annual Percent Change 6 |
|---|---|---|
| Transportation and Warehousing | 36.7% | -2% |
| Wholesale Trade | 17.5% | -1.2% |
| Personal consumption | 9.6% | +3.4% |
| Exports | 6.1% | +46.7% |
| Retail Trade | 5.9% | +4.5% |
- Pricing measured from January 2020.
- The BLS PPI used for this industry is PCU488---488---.
- Costs measured from January 2020
- Demand measured from July 2019