Other retail
Industry profile, February 2020
Sections: Description | Pricing | Costs | Demand | Appendix
This page is an industry profile for the Other retail industry. It provides a general economic overview of recent developments in the industry. This includes information on industry pricing, costs, and demand. Below you will find a description of what type of business establishments are included in this industry. For information on how to best utilize this industry profile please visit our Business Solutions.
Industry Description
This industry group comprises establishments primarily engaged in retailing new miscellaneous specialty store merchandise (except motor vehicle and parts dealers; furniture and home furnishings stores; consumer-type electronics and appliance stores; building material and garden equipment and supplies dealers; food and beverage stores; health and personal care stores; gasoline stations; clothing and clothing accessories stores; sporting goods, hobby, book, and music stores; general merchandise stores; florists; office supplies, stationery, and gift stores; and used merchandise stores). This industry group also includes establishments primarily engaged in retailing a general line of new and used merchandise on an auction basis (except electronic auctions).
This industry description was sourced from the North American Industry Classification System.
To download this data, or to learn more about how pricing is measured, please contact us.
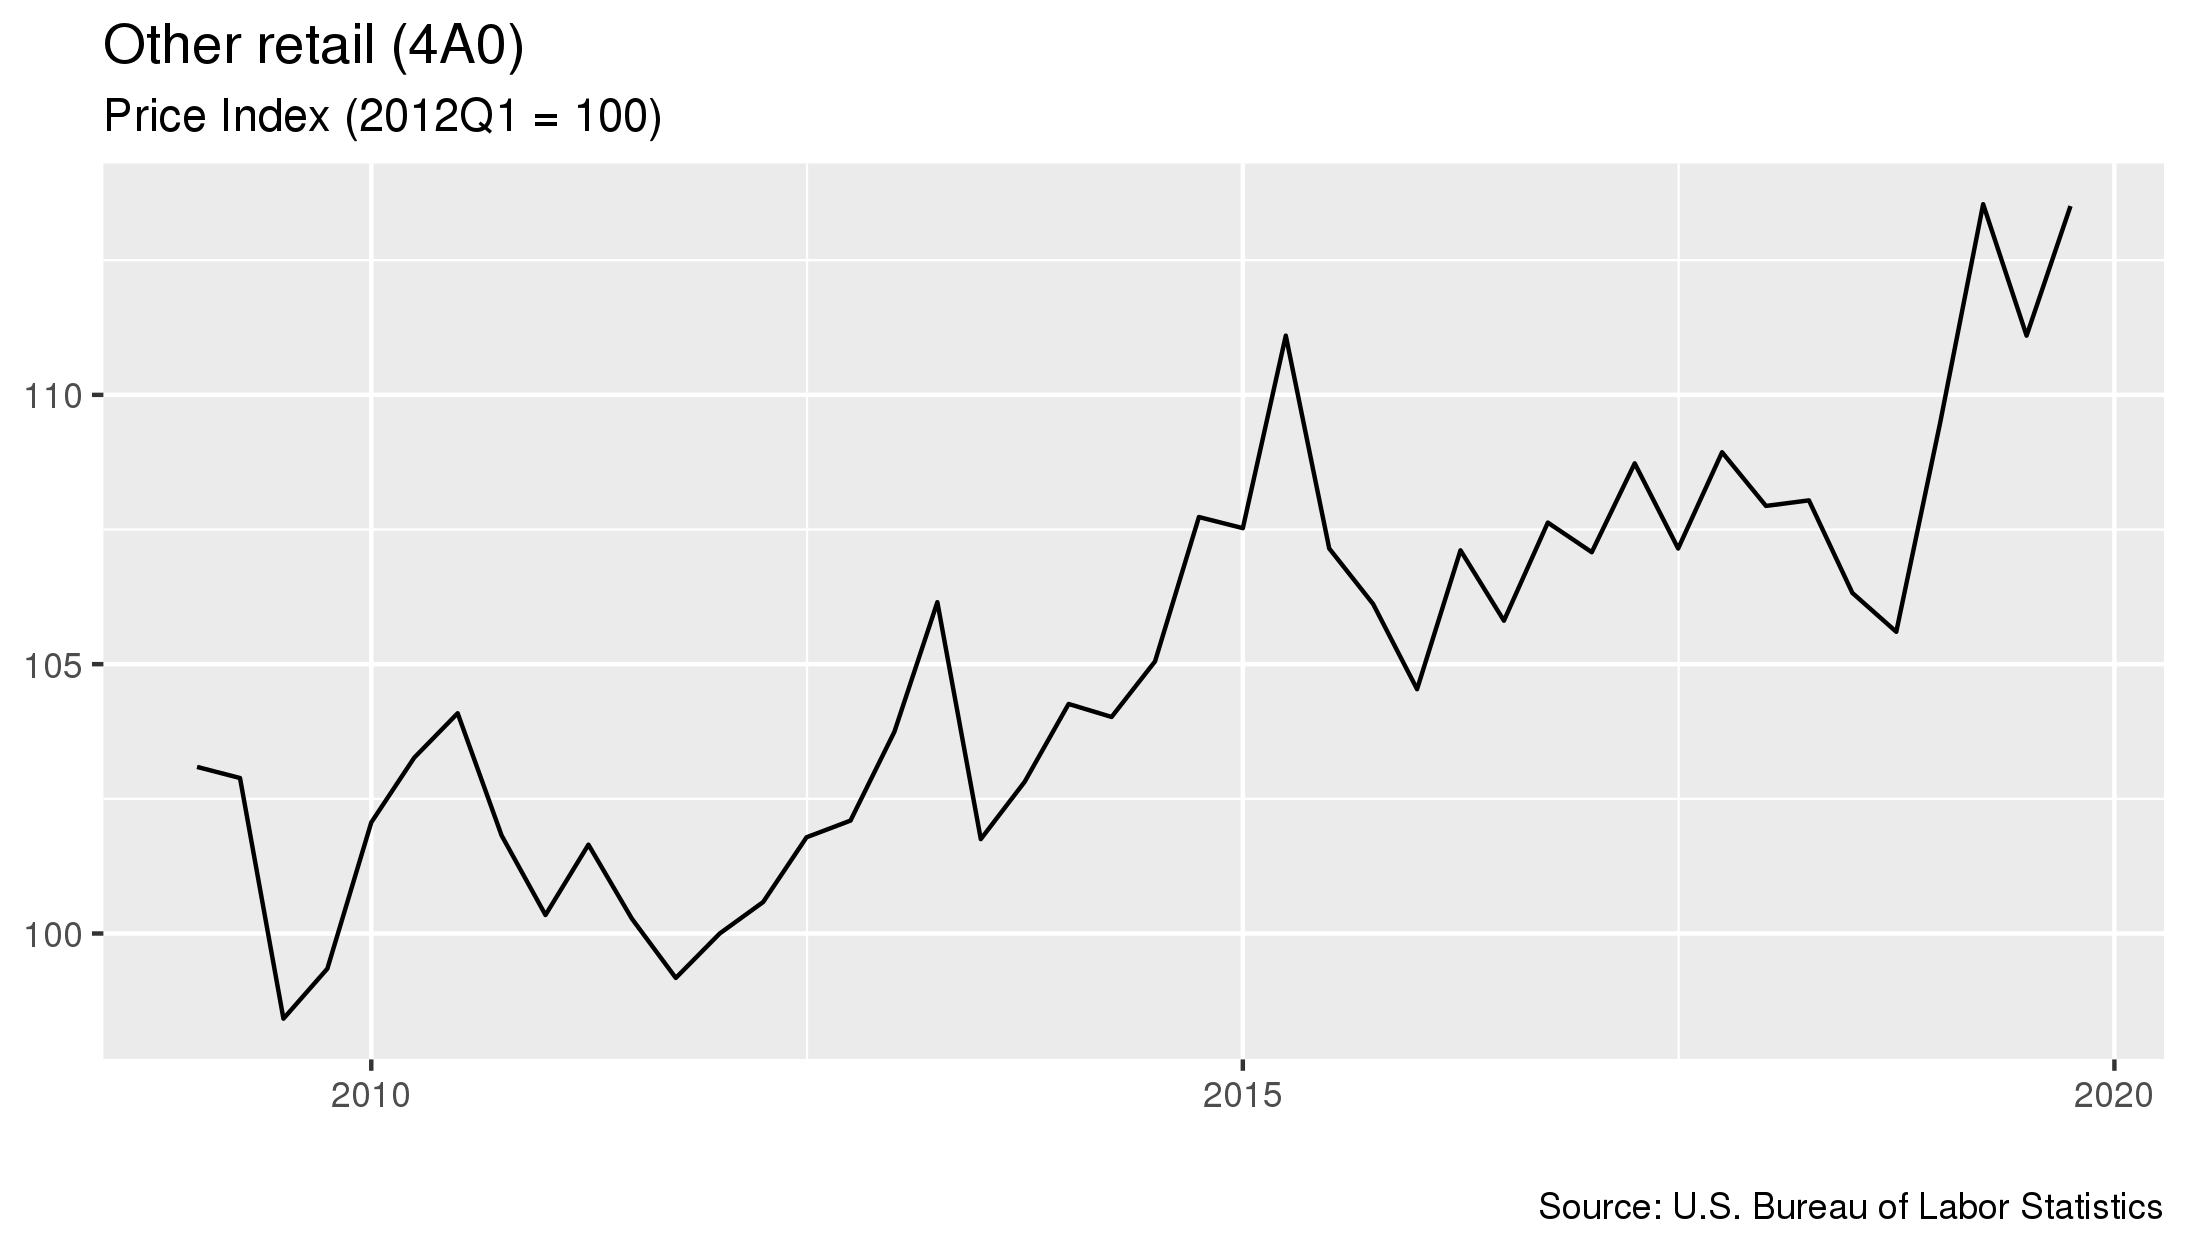
- As of January 2020, prices in this industry had increased 2.2 percent since the previous quarter.
- From January 2019 to January 2020 prices in this industry increased 7.5 percent.
- Prices increased 7 percent in the five year period starting in January 2015 and ending in January 2020.
To download this data, or to learn more about how costs for this industry are measured, please contact us.
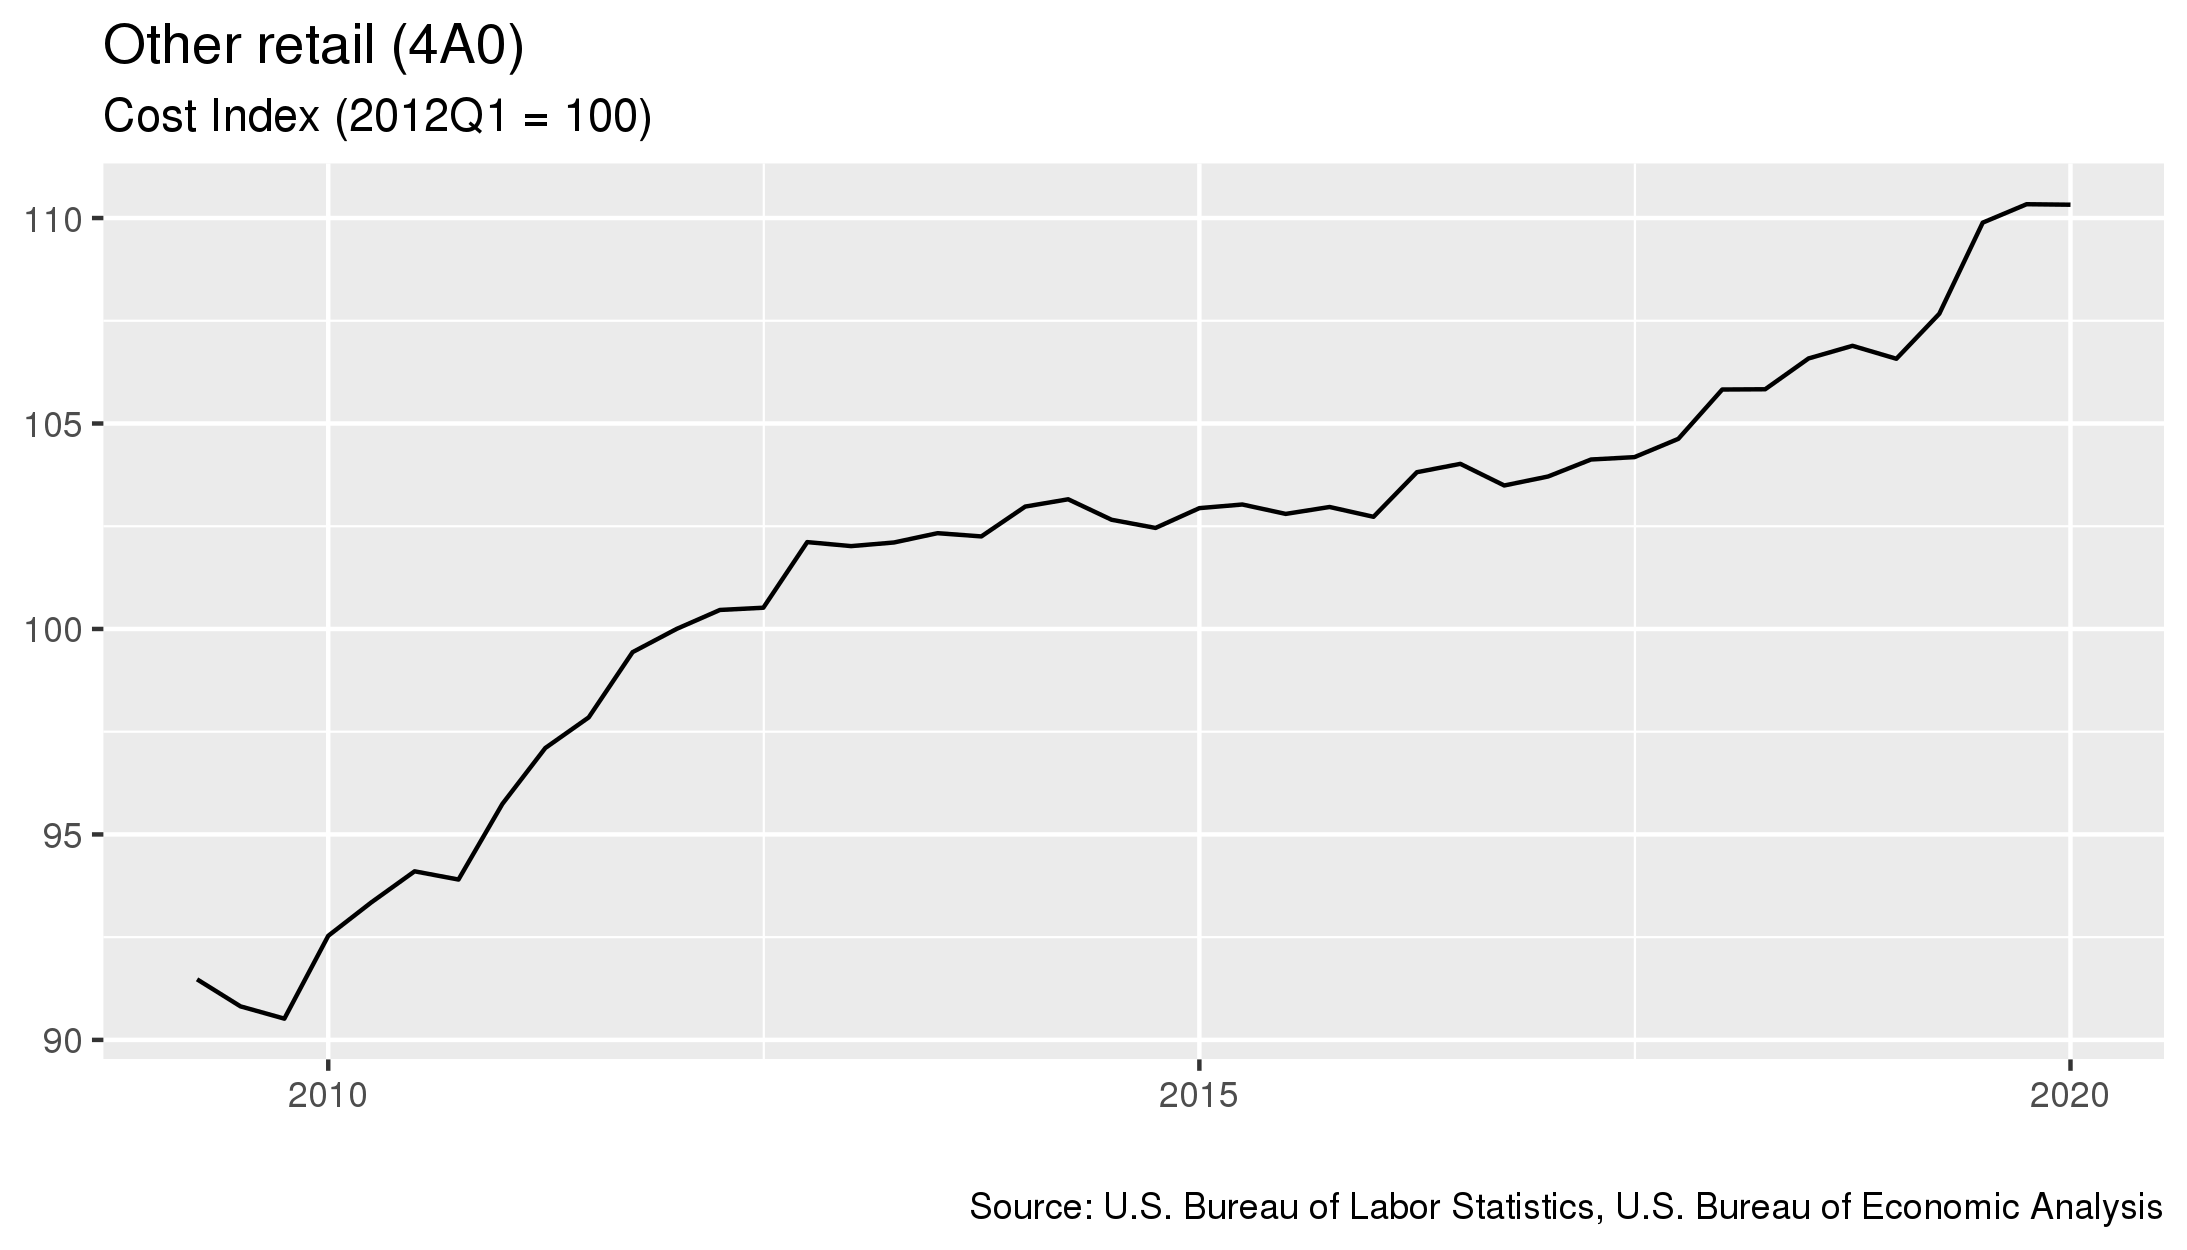
- As of January 2020, costs in this industry had 0 percent since the previous quarter.
- From January 2019 to January 2020 costs in this industry increased 3.5 percent.
- Costs increased 7.4 percent in the five year period starting in January 2015 and ending in January 2020.
For details on which industries are included in each sector, click here
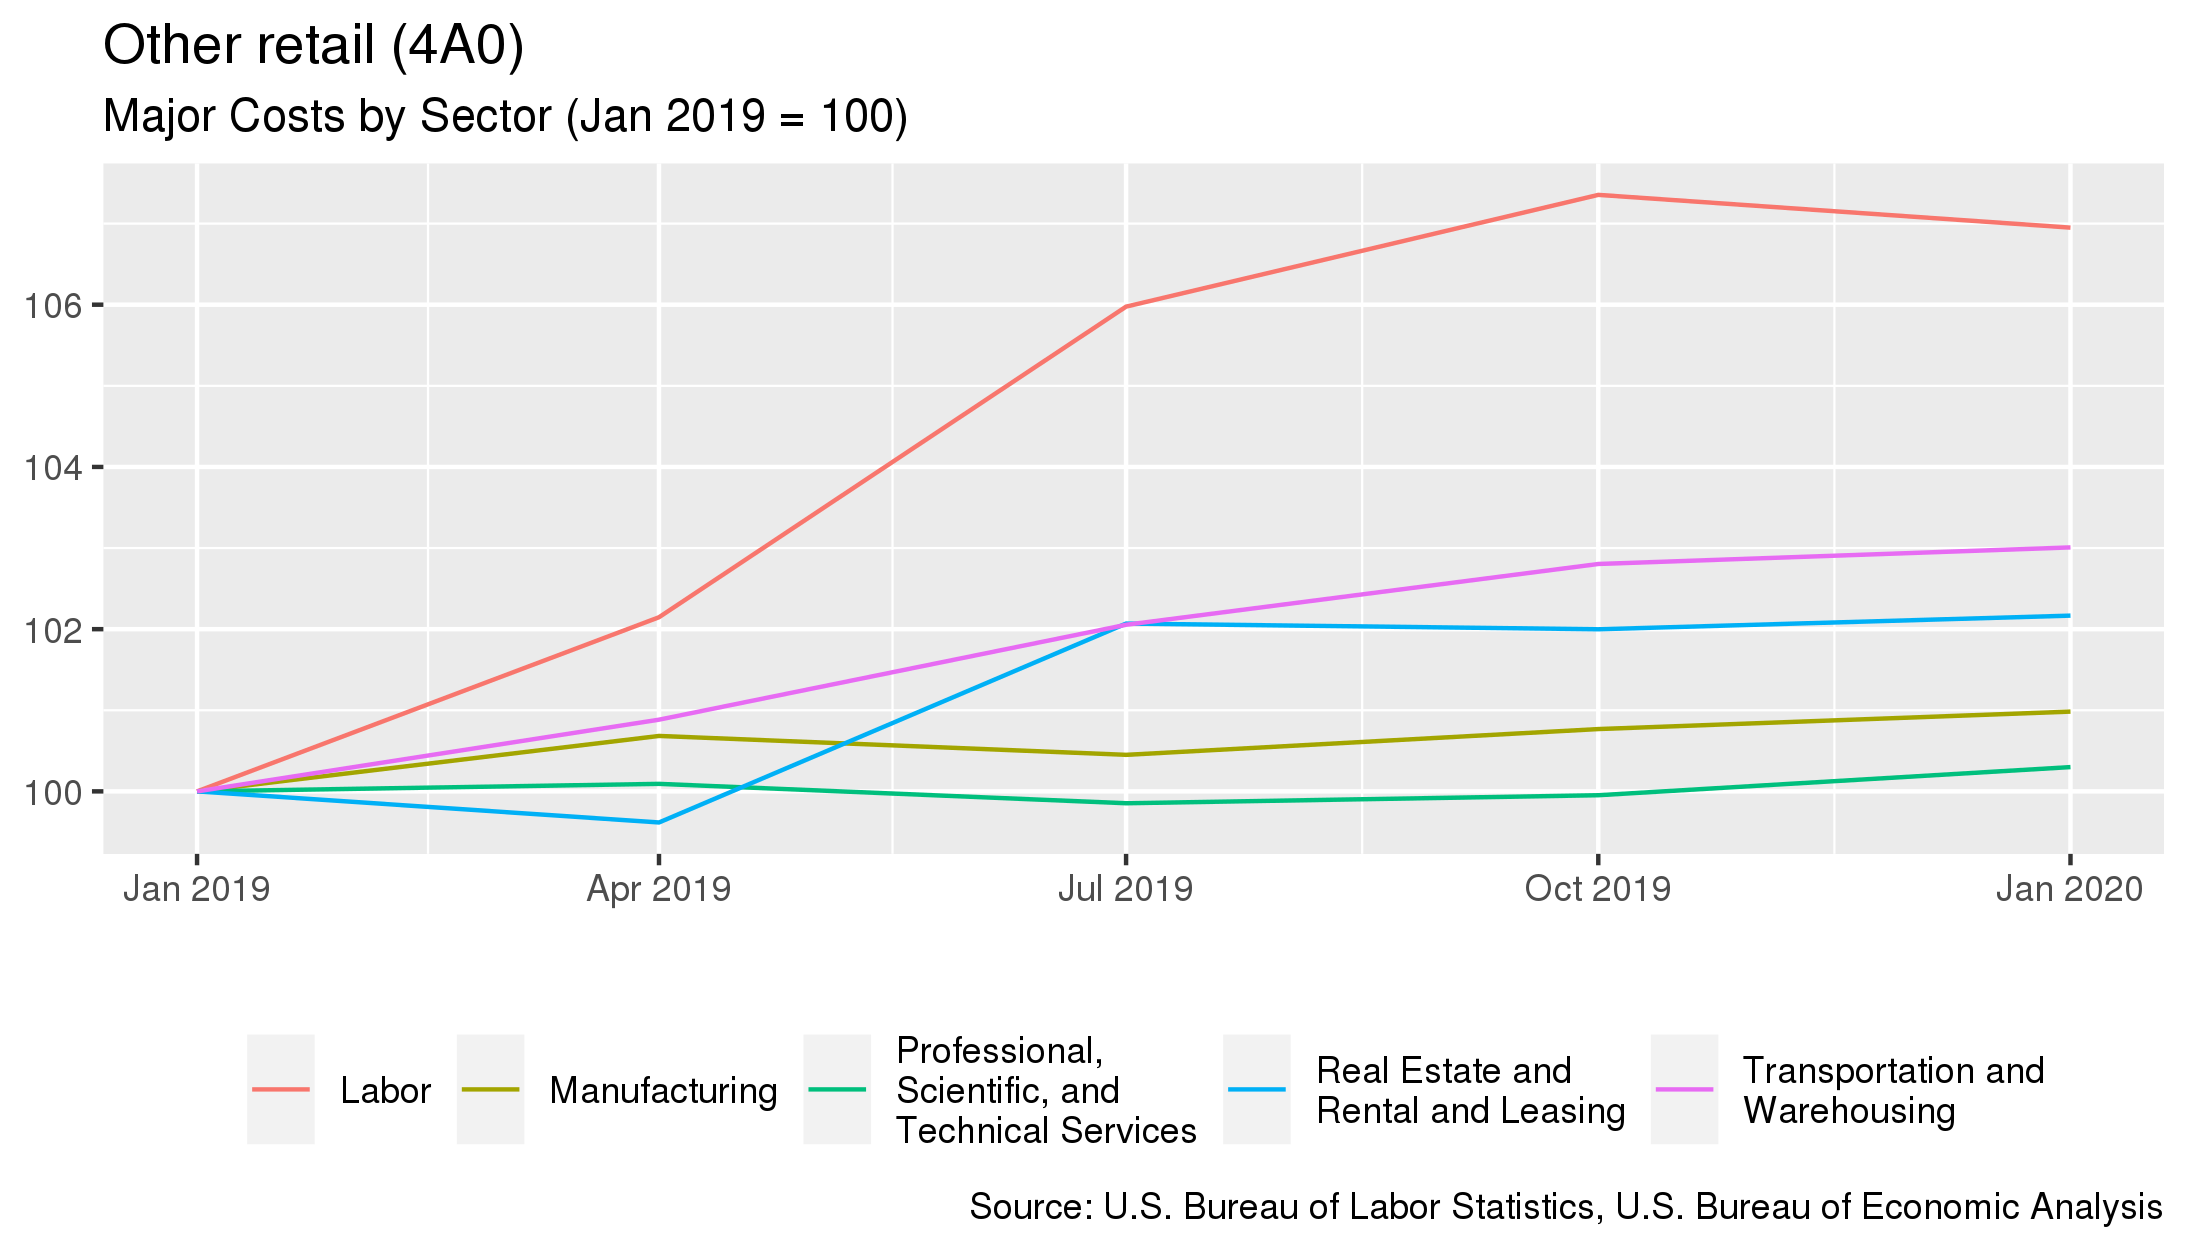
- The largest cost for this industry is purchases made to the Labor sector. This sector accounts for 42% of the industry's overall costs.
- From January 2019 to January 2020, the largest change in costs for this industry were costs associated with purchases to the Labor sector. Costs associated with this sector increased 6.9%.
| Sector Name | Percentage of Costs | Annual Percent Change 4 |
|---|---|---|
| Labor | 42% | +6.9% |
| Real Estate and Rental and Leasing | 16.2% | +2.2% |
| Professional, Scientific, and Technical Services | 9% | +0.3% |
| Manufacturing | 6.6% | +1% |
| Transportation and Warehousing | 5.3% | +3% |
To download this data, or to learn more about how demand for this industry is measured, please contact us.
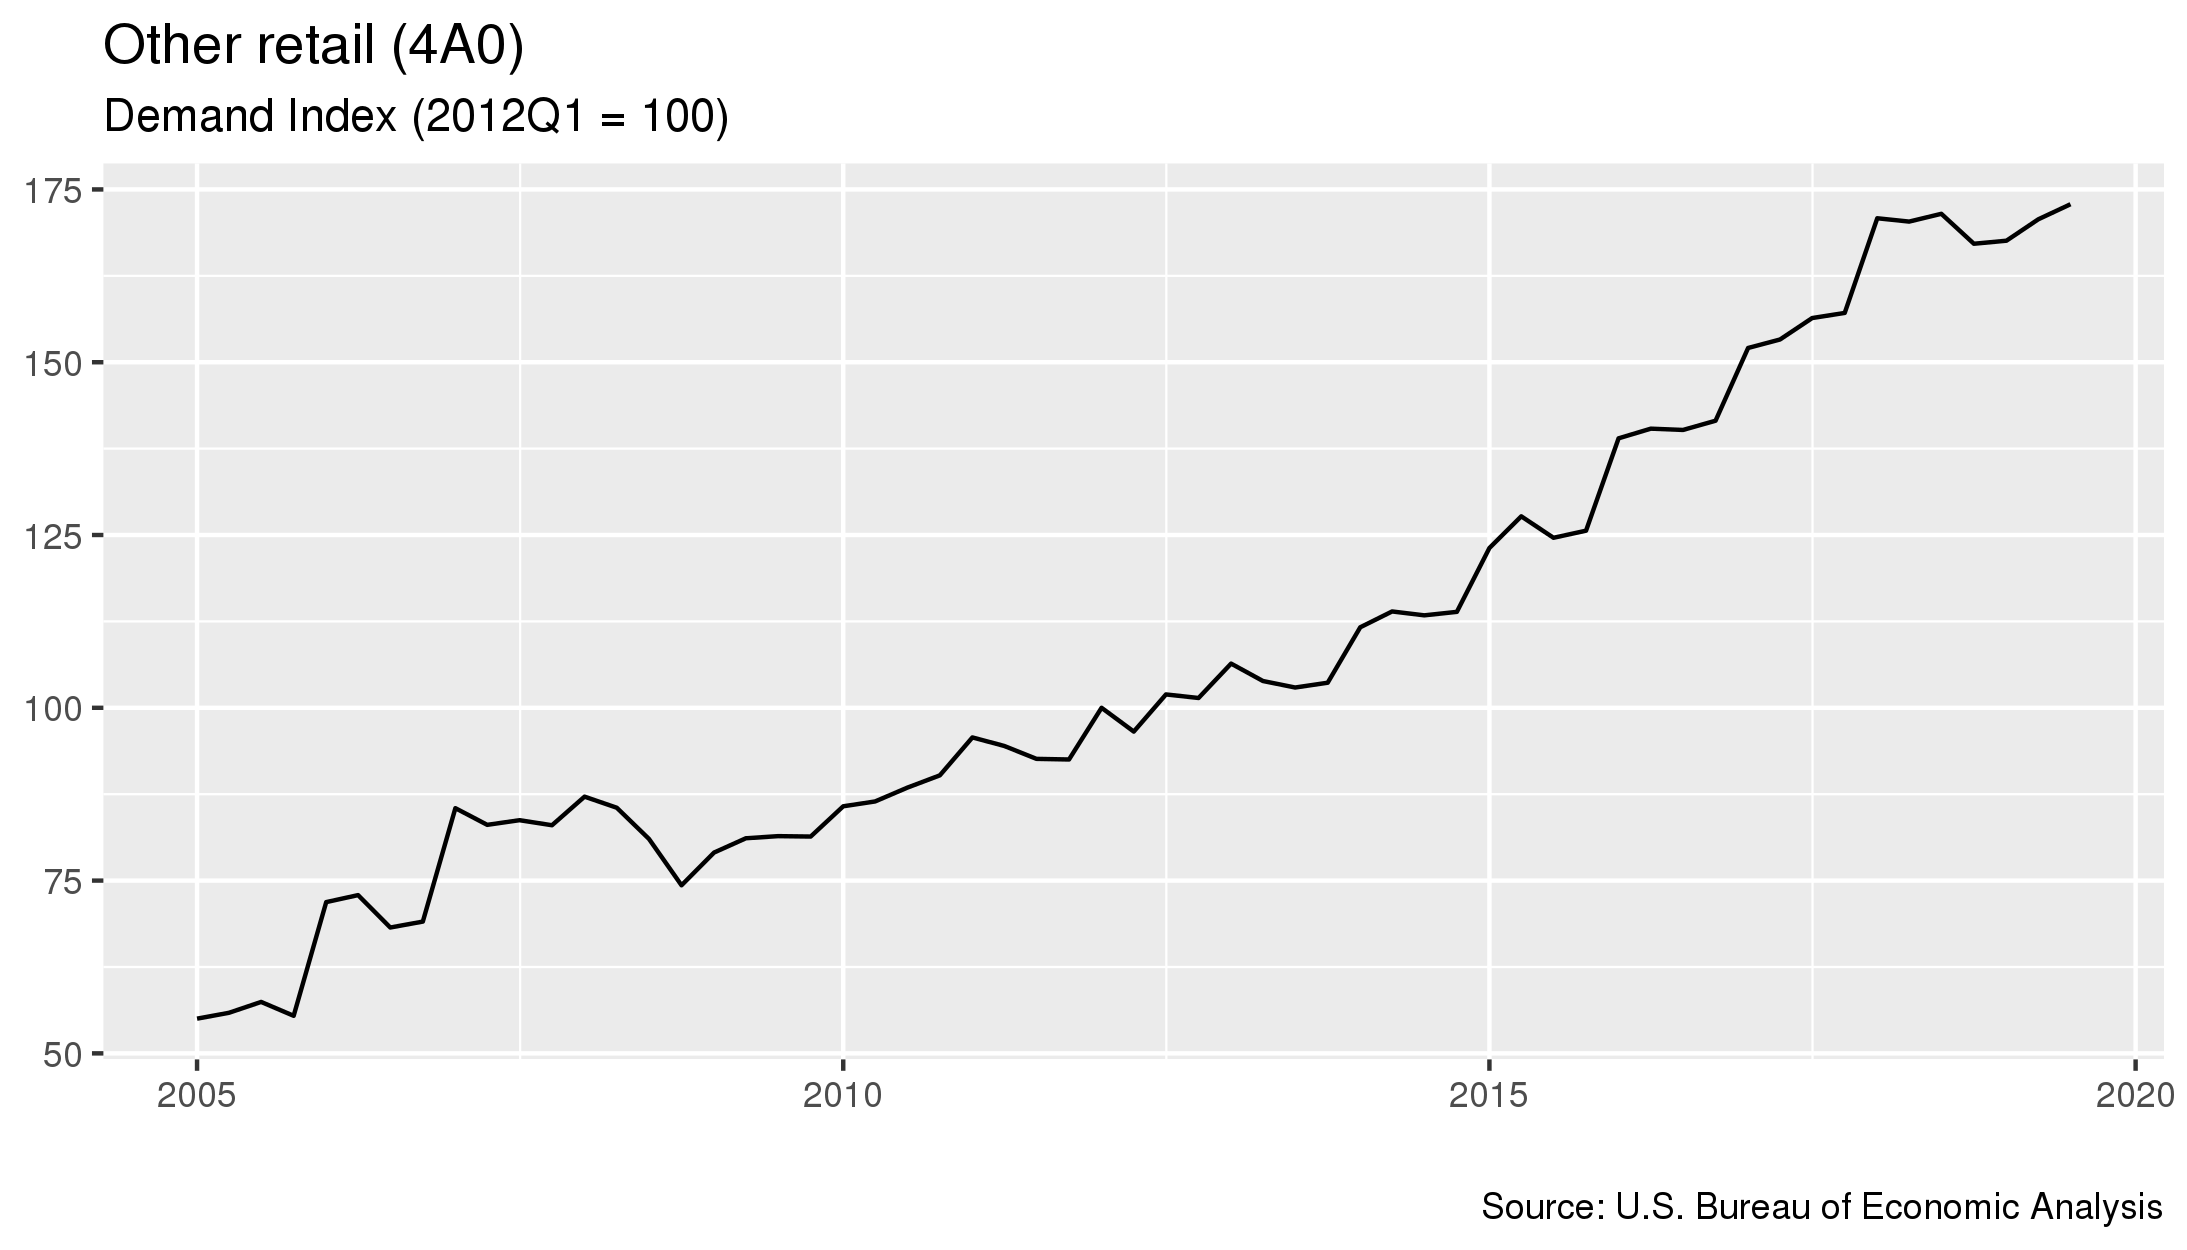
- As of July 2019, demand for this industry had increased 1.3 percent since the previous quarter.
- From July 2018 to January 2020 costs in this industry increased 0.8 percent.
- Costs increased 38.7 percent in the five year period starting in July 2014 and ending in July 2019.
For details on which industries are included in each sector, click here
- The sector that contributes the most to this industry's demand is the Personal consumption sector. This sector accounts for 77.8% of the industry's overall demand.
- From January 2019 to January 2020, the largest change in demand for this industry was from the Other Services (except Public Administration) sector, where demand decreased -2.5%.
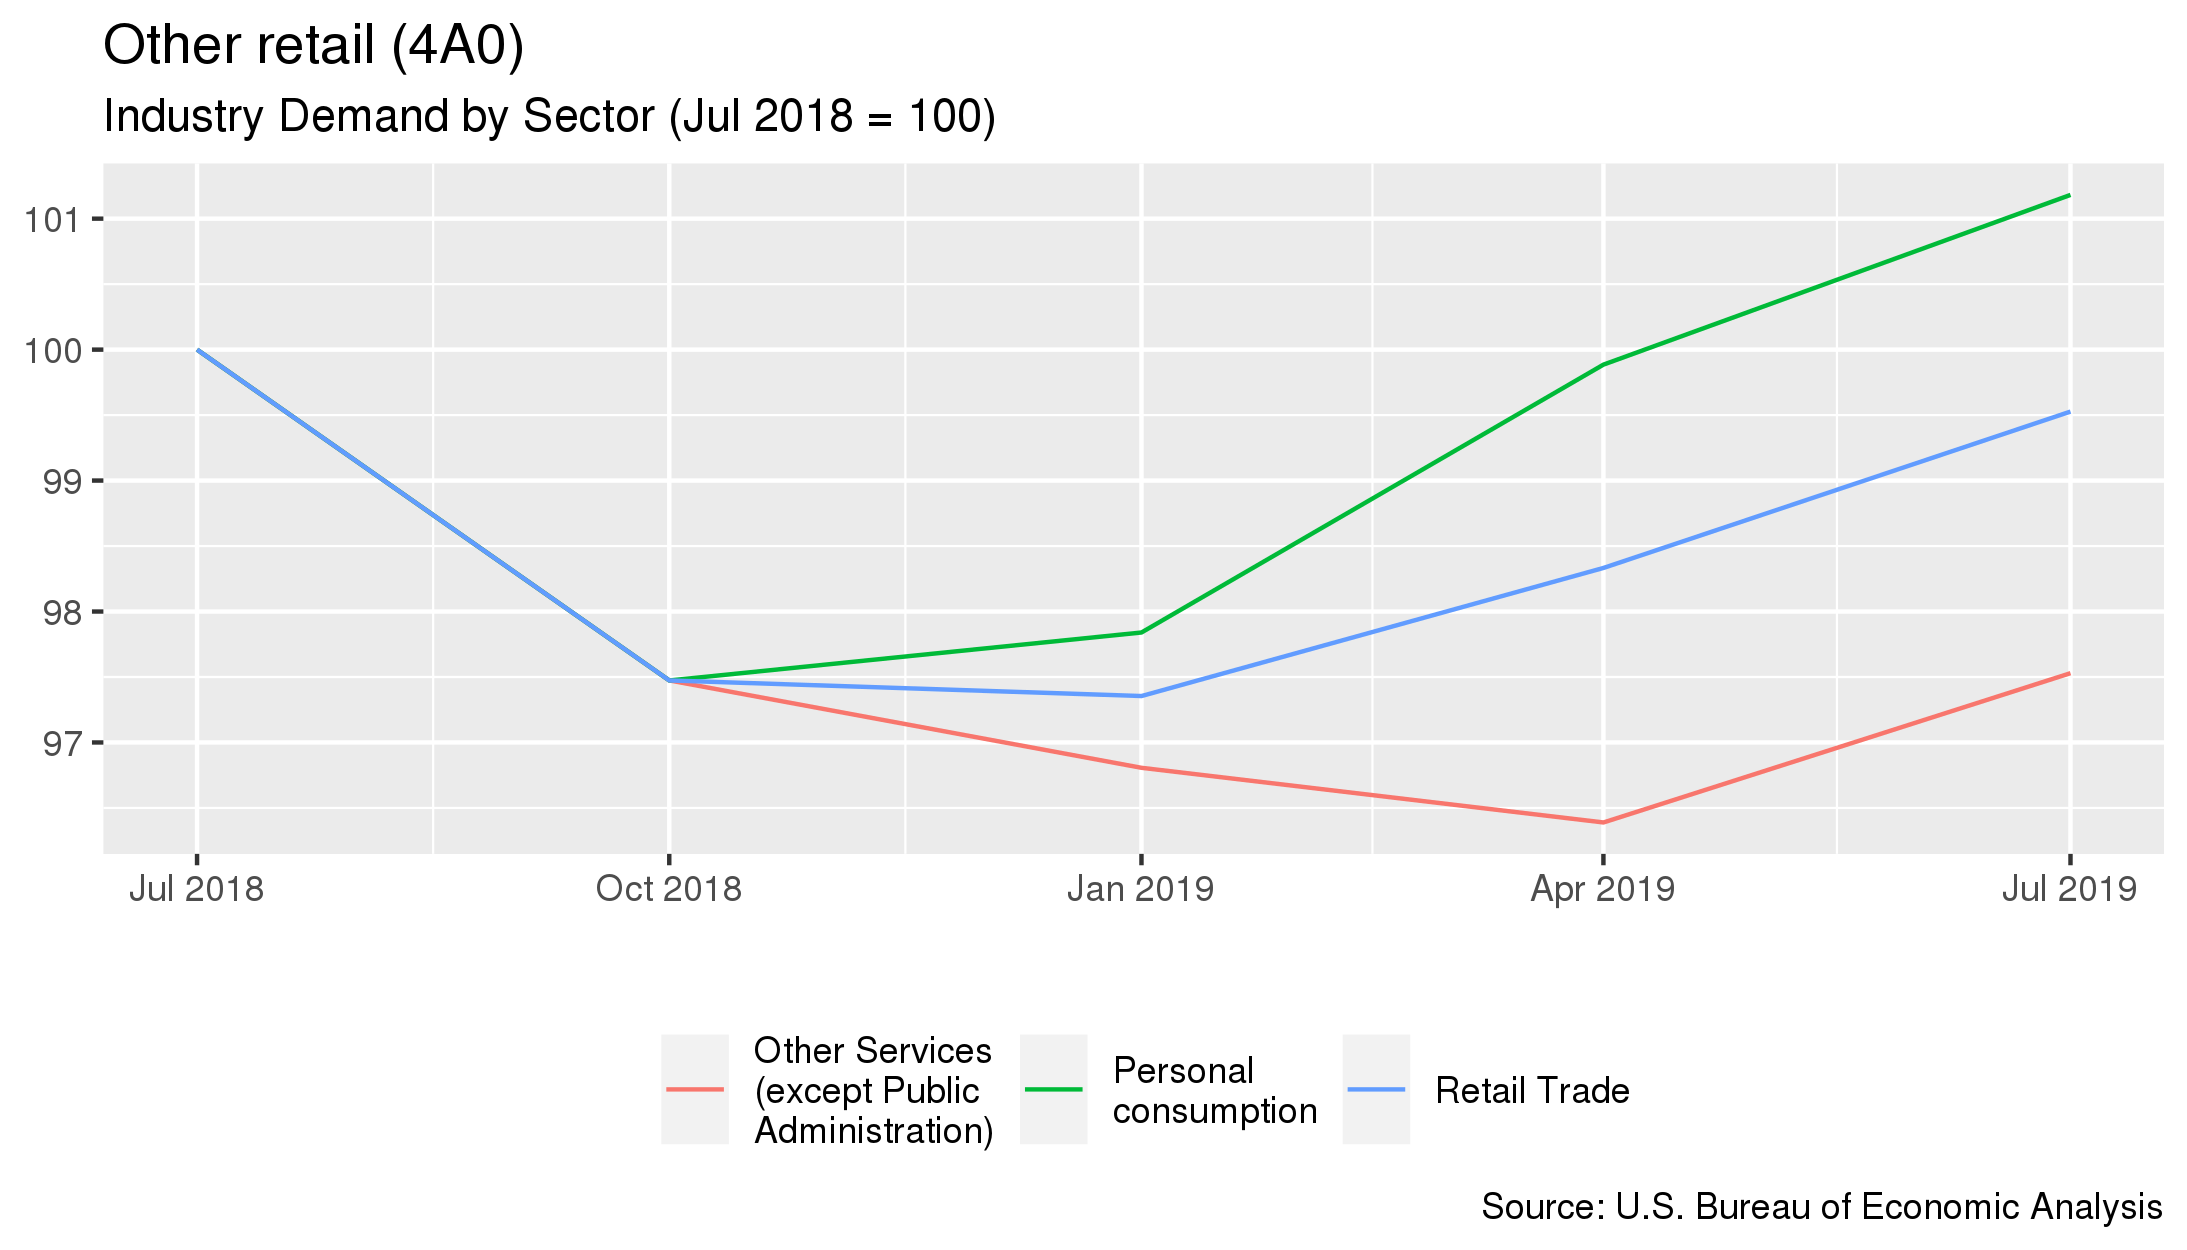
| Sector Name | Percentage of Demand | Annual Percent Change 6 |
|---|---|---|
| Personal consumption | 77.8% | +1.2% |
| Retail Trade | 22.1% | -0.5% |
| Other Services (except Public Administration) | 0% | -2.5% |
| - | - | - |
| - | - | - |
- Pricing measured from January 2020.
- The BLS PPI used for this industry is WPU58I.
- Costs measured from January 2020
- Demand measured from July 2019