Waste management and remediation services
Industry profile, February 2020
Sections: Description | Pricing | Costs | Demand | Appendix
This page is an industry profile for the Waste management and remediation services industry. It provides a general economic overview of recent developments in the industry. This includes information on industry pricing, costs, and demand. Below you will find a description of what type of business establishments are included in this industry. For information on how to best utilize this industry profile please visit our Business Solutions.
Industry Description
Industries in the Waste Management and Remediation Services subsector group establishments engaged in the collection, treatment, and disposal of waste materials. This includes establishments engaged in local hauling of waste materials; operating materials recovery facilities (i.e., those that sort recyclable materials from the trash stream); providing remediation services (i.e., those that provide for the cleanup of contaminated buildings, mine sites, soil, or ground water); and providing septic pumping and other miscellaneous waste management services. There are three industry groups within the subsector that separate these activities into waste collection, waste treatment and disposal, and remediation and other waste management.
This industry description was sourced from the North American Industry Classification System.
To download this data, or to learn more about how pricing is measured, please contact us.
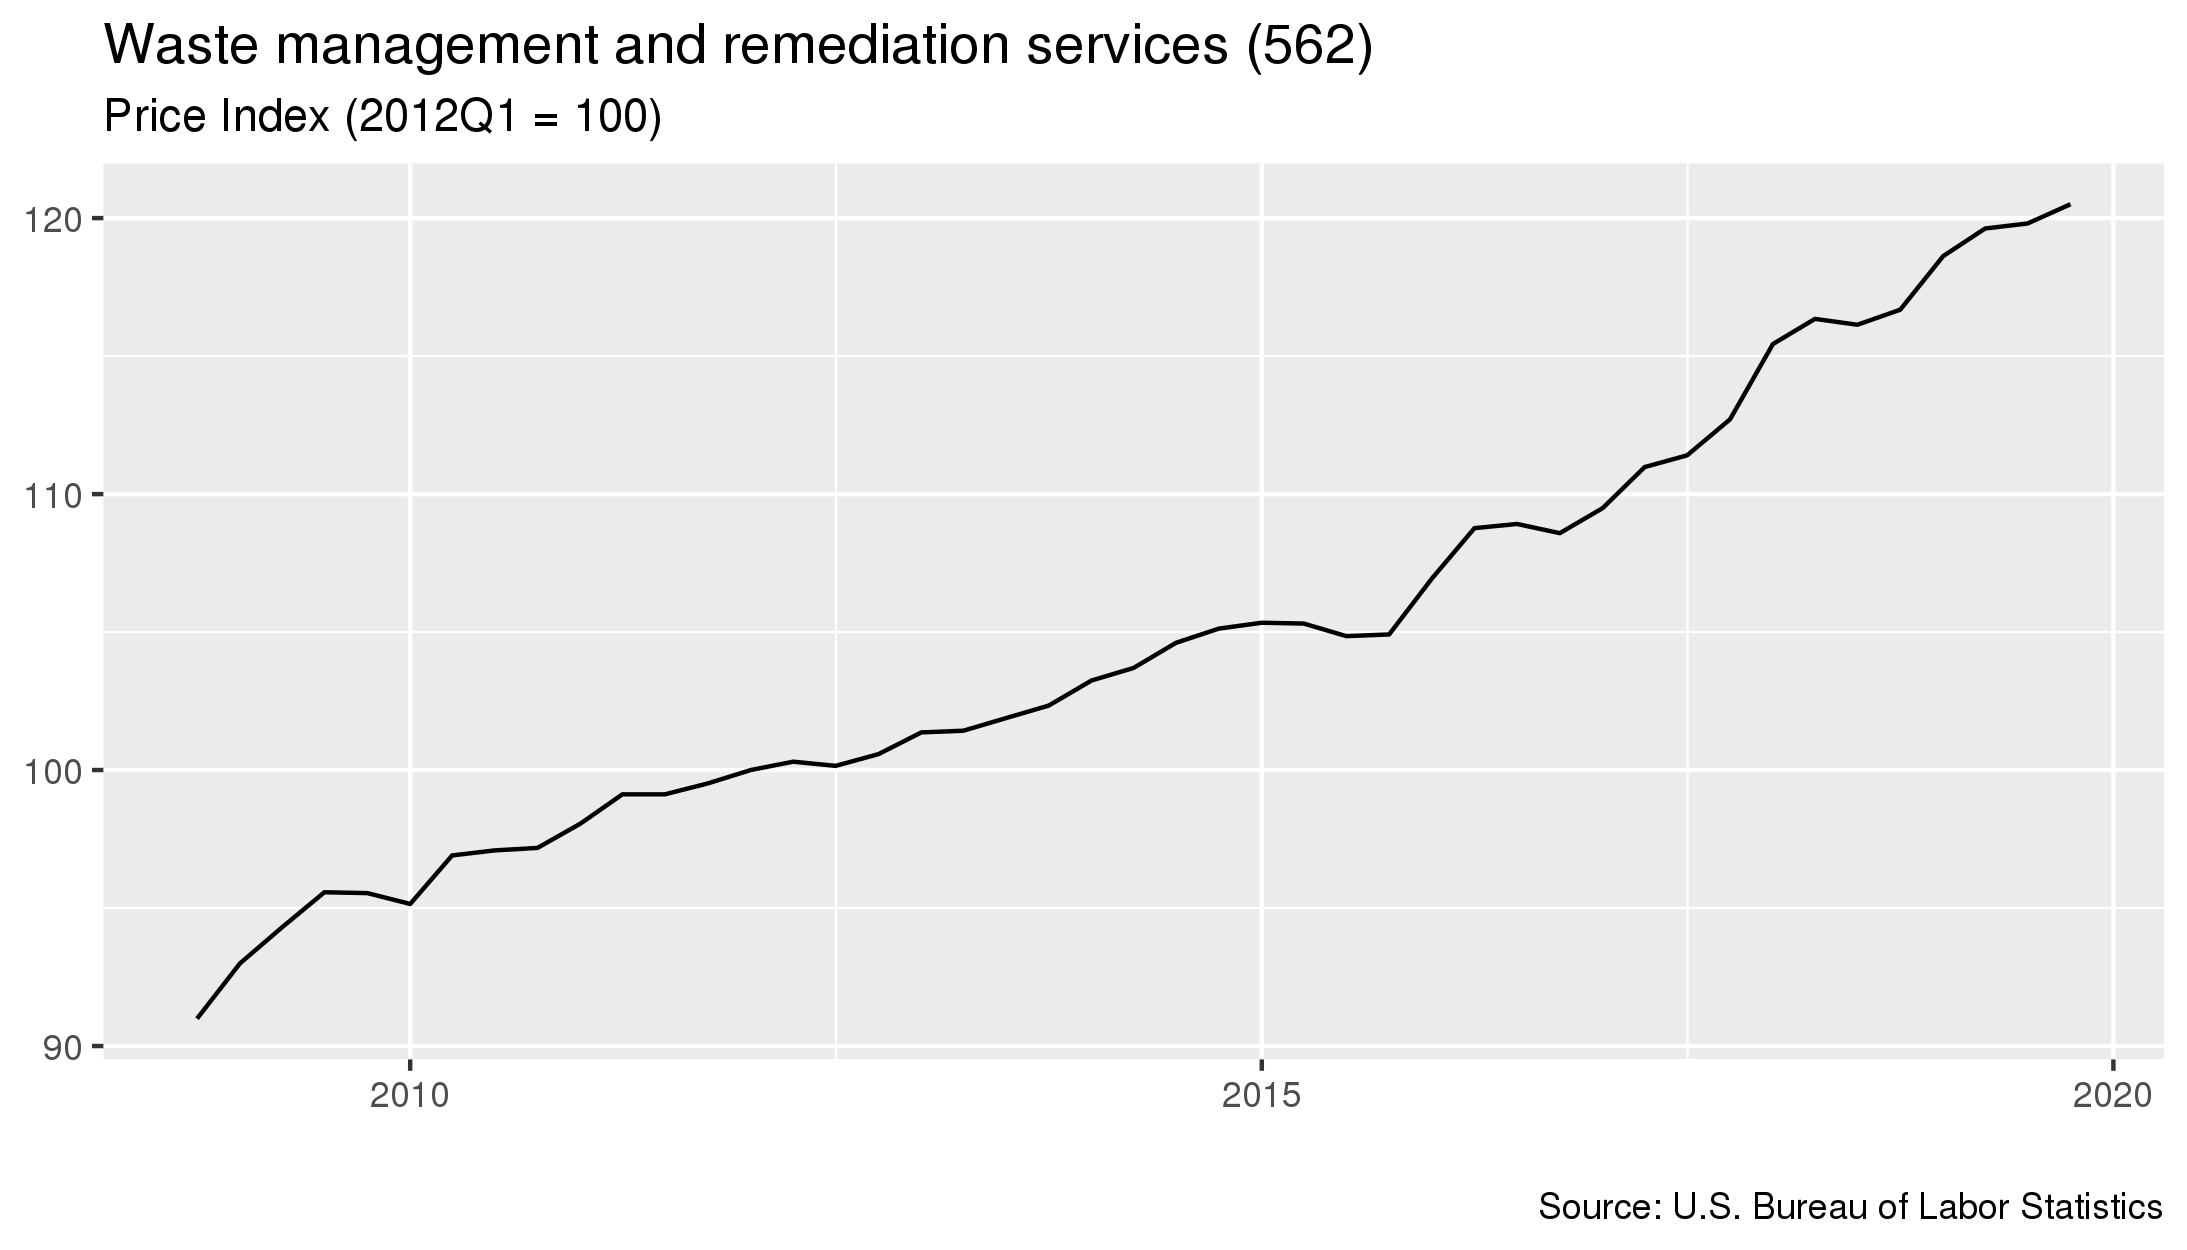
- As of January 2020, prices in this industry had increased 0.6 percent since the previous quarter.
- From January 2019 to January 2020 prices in this industry increased 3.3 percent.
- Prices increased 14.9 percent in the five year period starting in January 2015 and ending in January 2020.
To download this data, or to learn more about how costs for this industry are measured, please contact us.
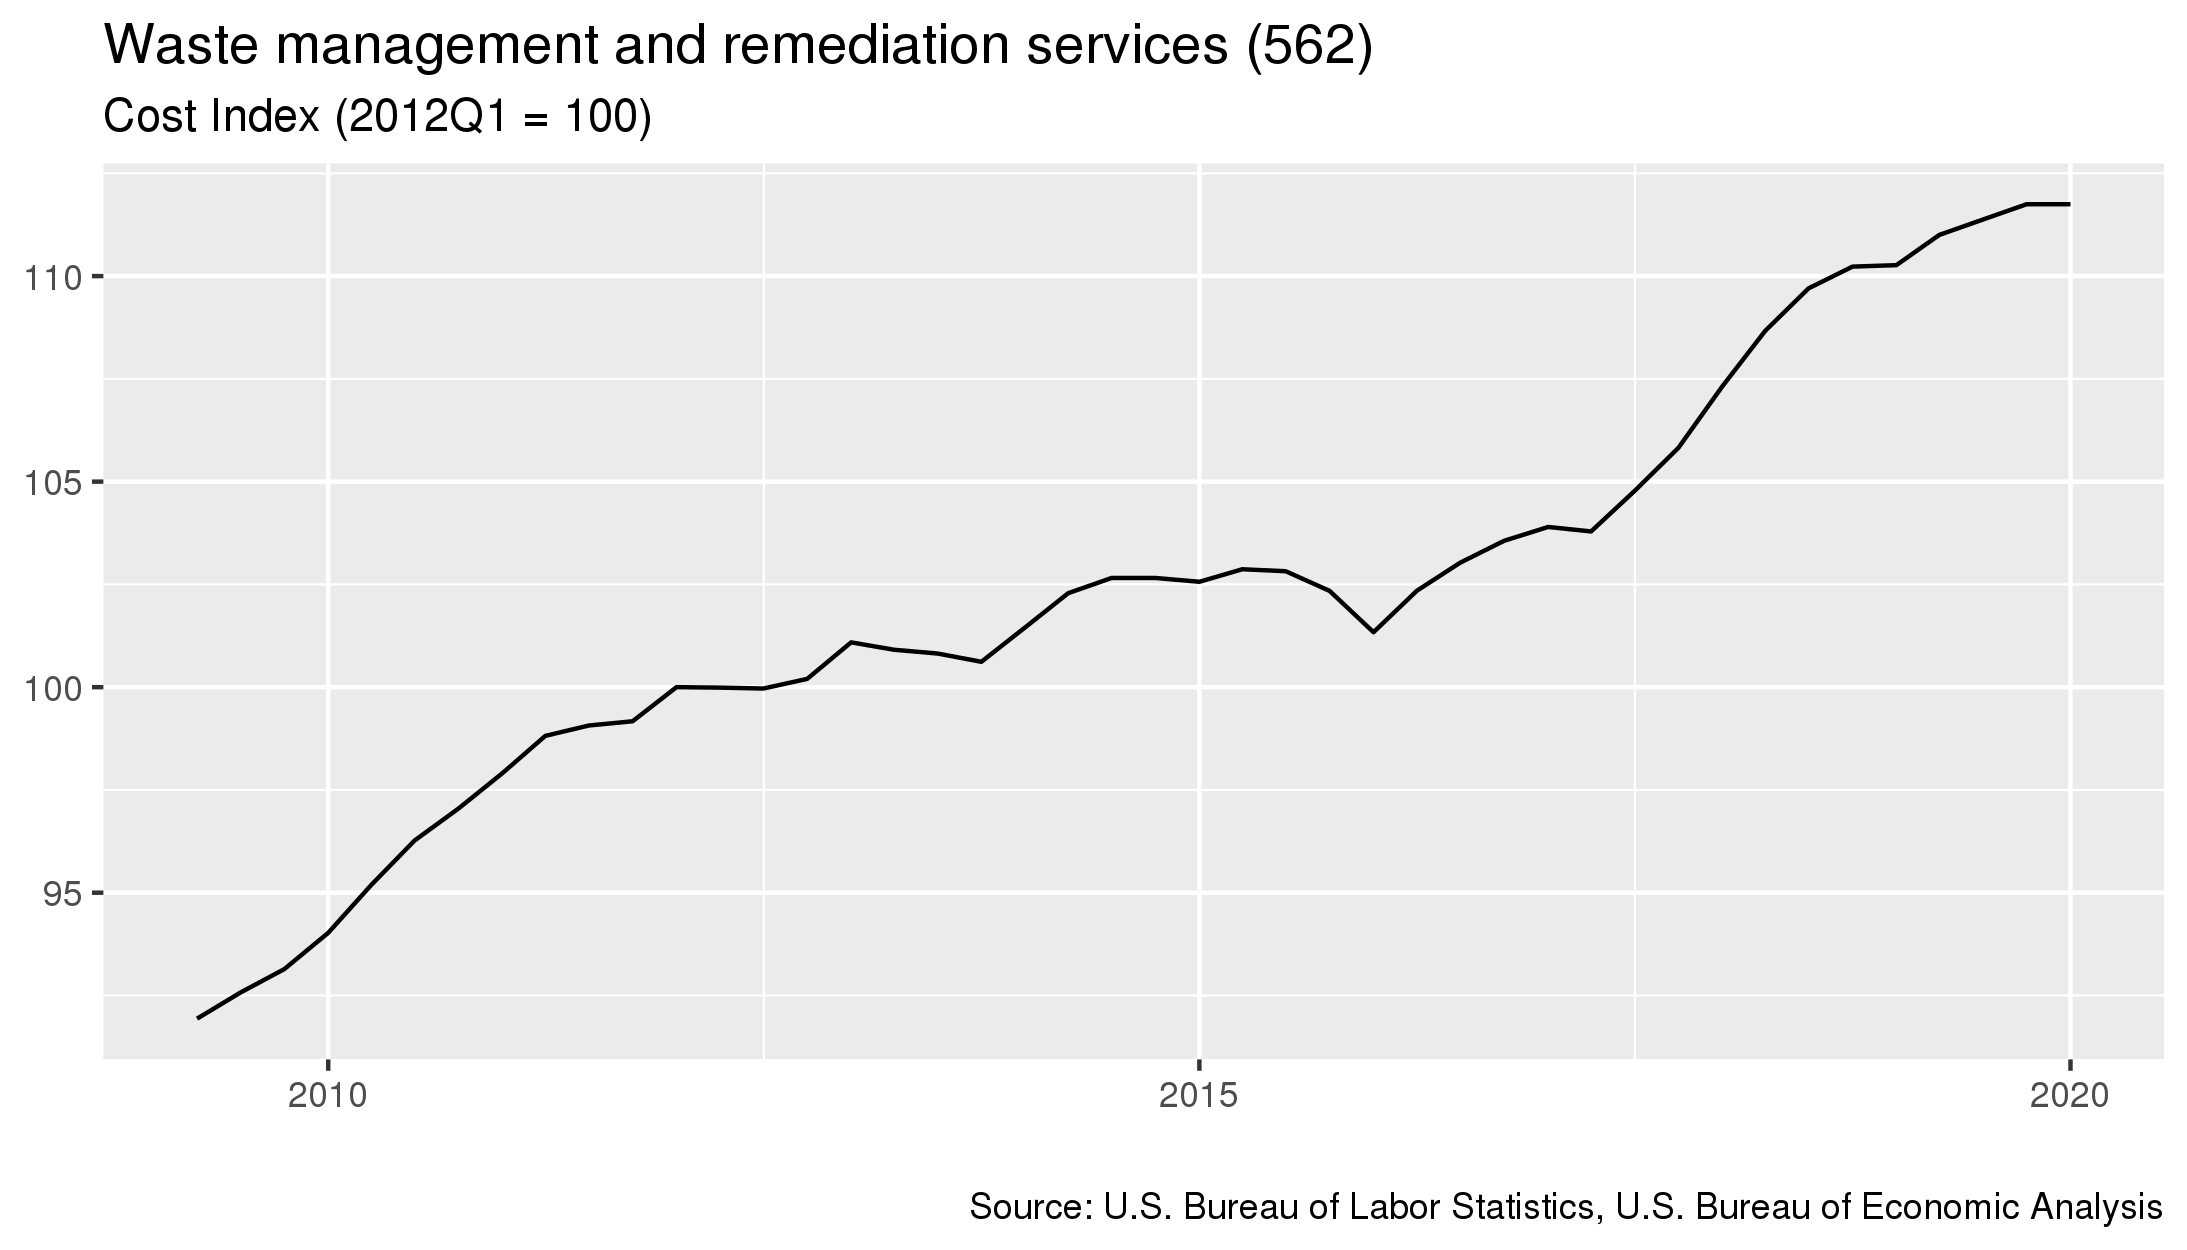
- As of January 2020, costs in this industry had 0 percent since the previous quarter.
- From January 2019 to January 2020 costs in this industry increased 1.3 percent.
- Costs increased 10.3 percent in the five year period starting in January 2015 and ending in January 2020.
For details on which industries are included in each sector, click here
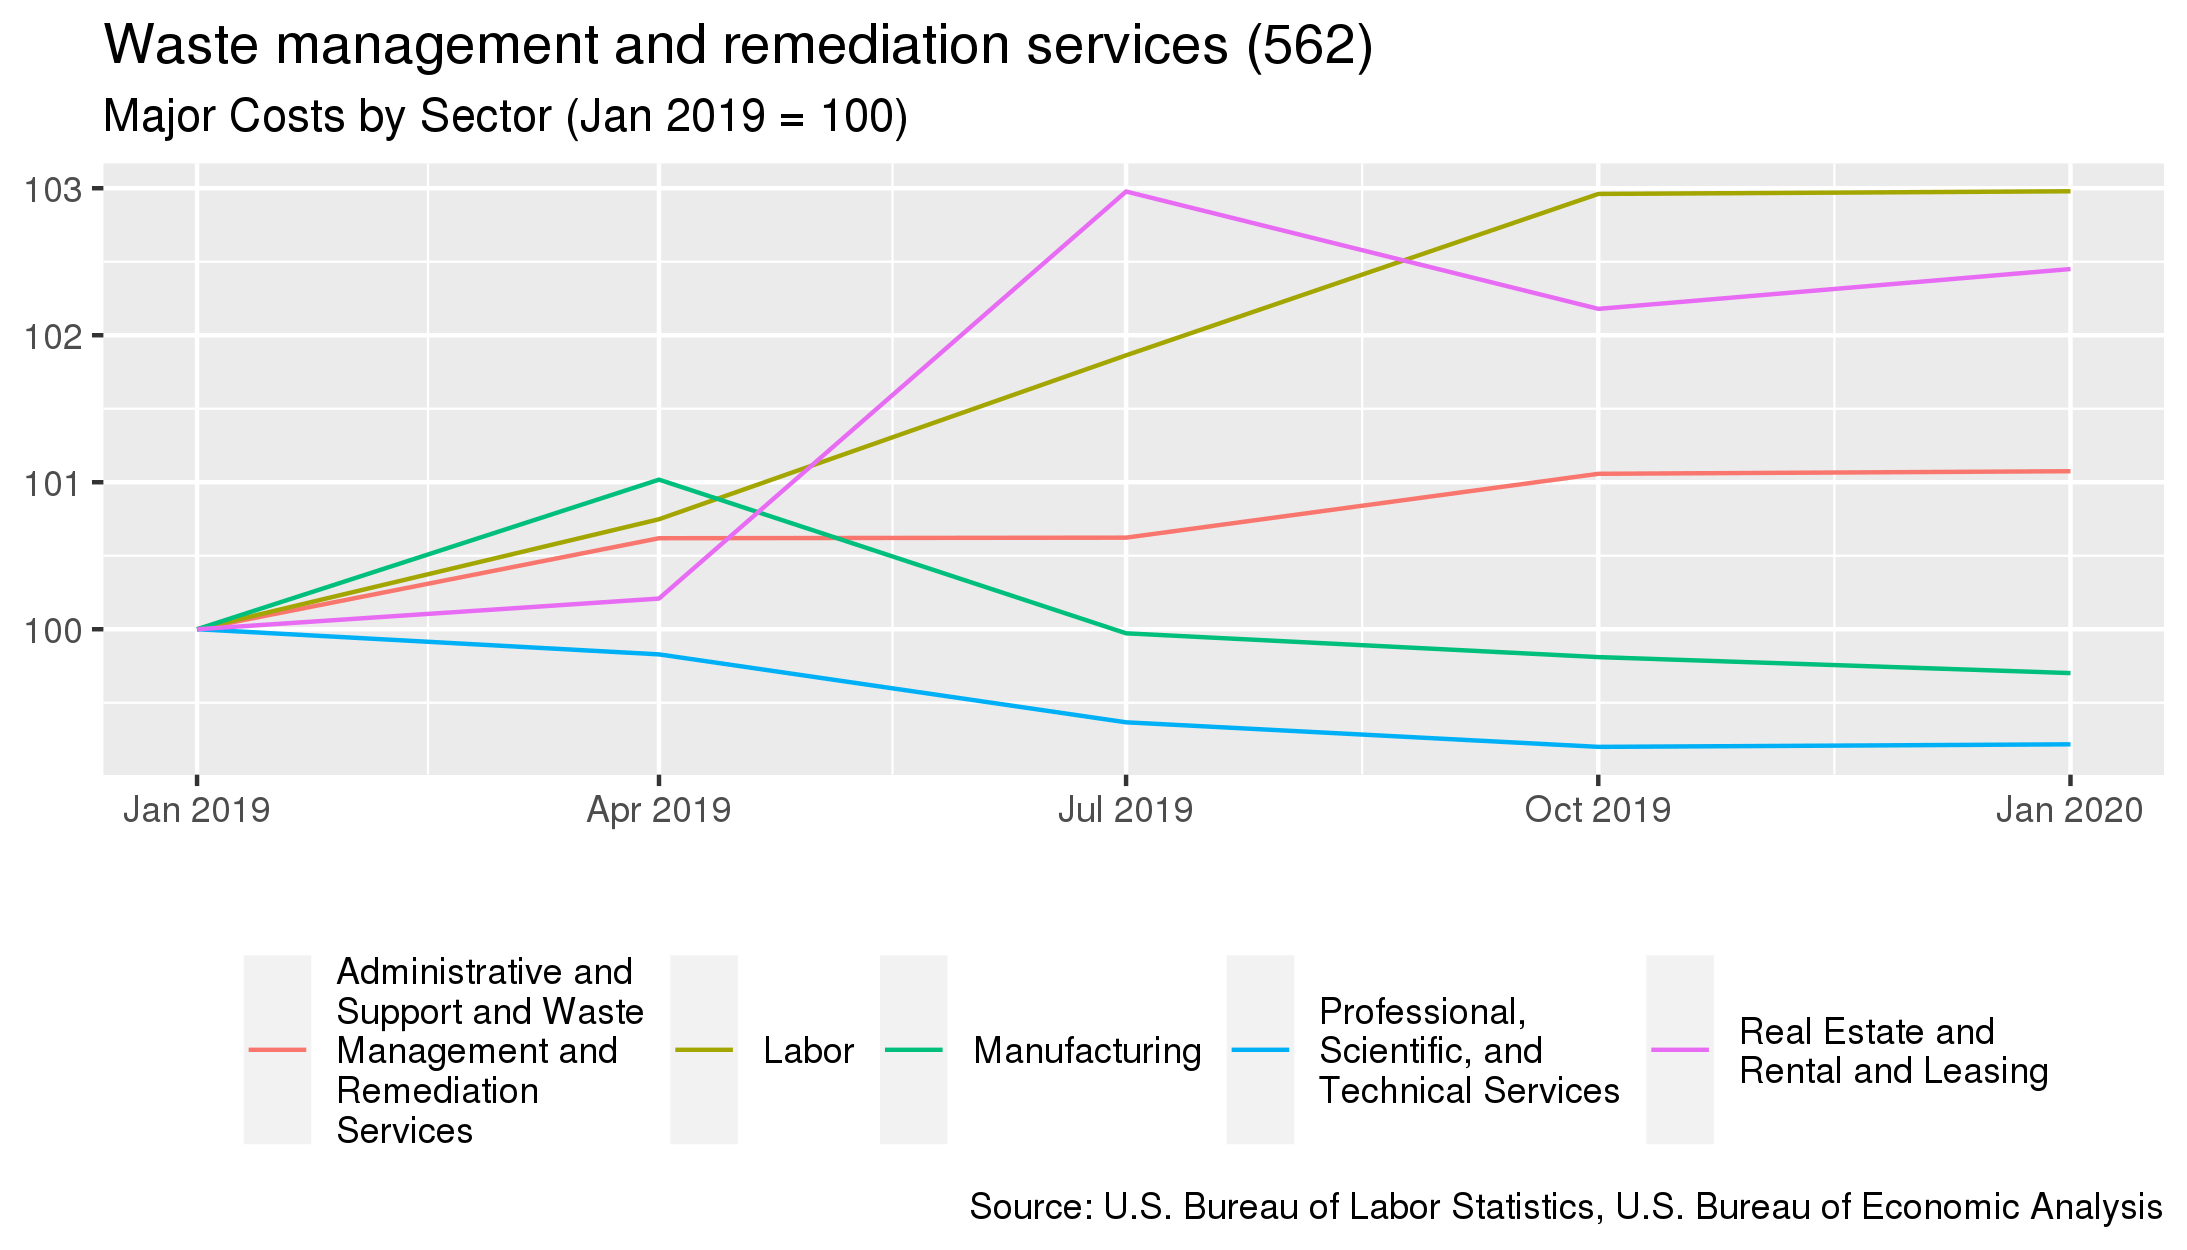
- The largest cost for this industry is purchases made to the Labor sector. This sector accounts for 40.2% of the industry's overall costs.
- From January 2019 to January 2020, the largest change in costs for this industry were costs associated with purchases to the Labor sector. Costs associated with this sector increased 3%.
| Sector Name | Percentage of Costs | Annual Percent Change 4 |
|---|---|---|
| Labor | 40.2% | +3% |
| Manufacturing | 18.9% | -0.3% |
| Administrative and Support and Waste Management and Remediation Services | 16.8% | +1.1% |
| Professional, Scientific, and Technical Services | 4.2% | -0.8% |
| Real Estate and Rental and Leasing | 4% | +2.5% |
To download this data, or to learn more about how demand for this industry is measured, please contact us.
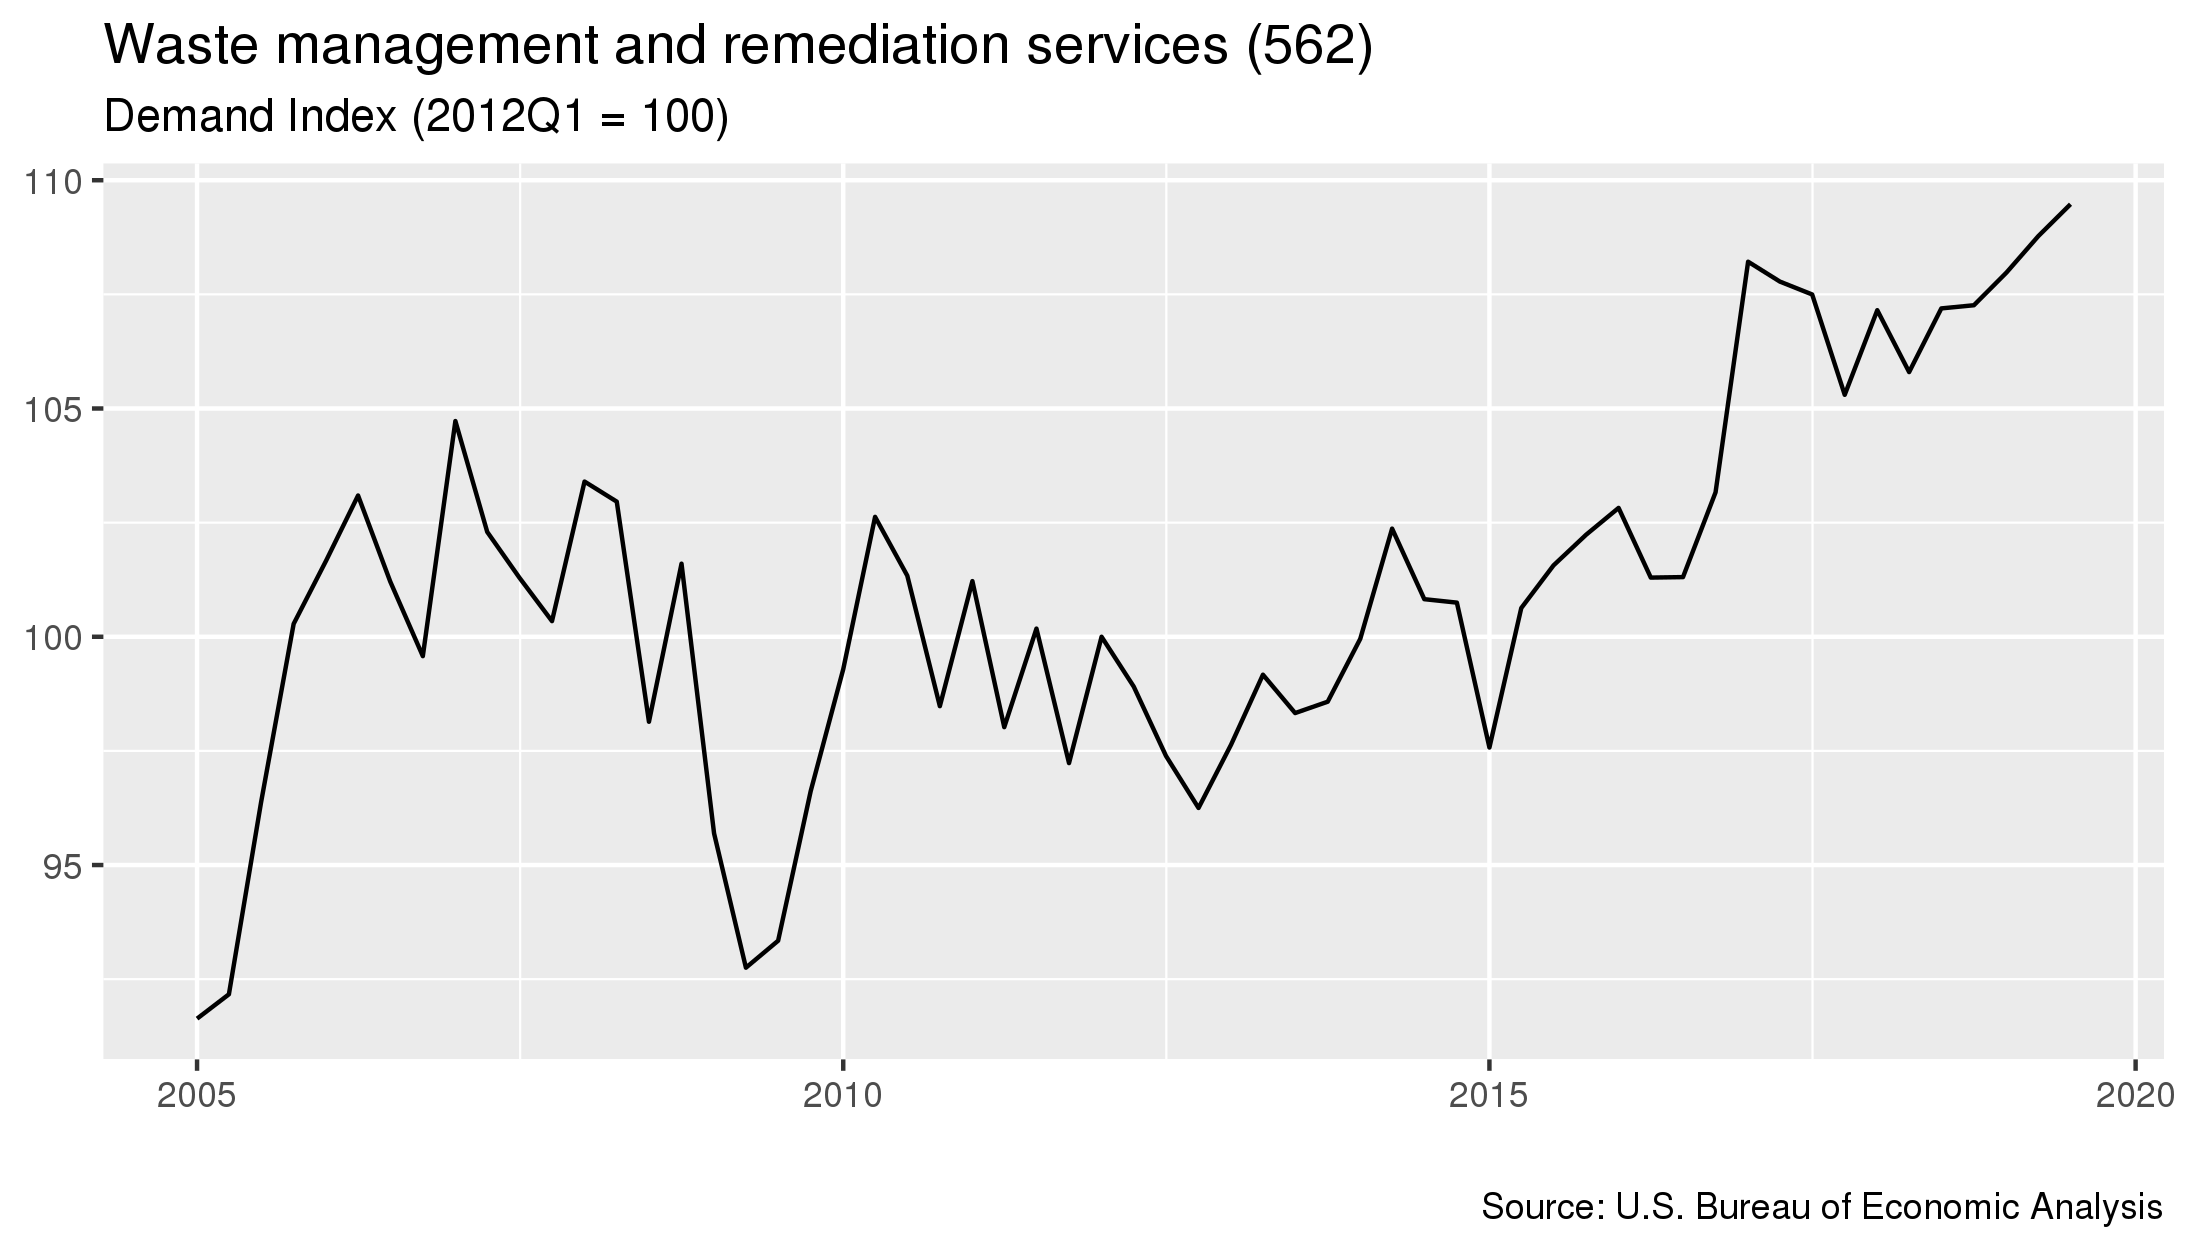
- As of July 2019, demand for this industry had increased 0.6 percent since the previous quarter.
- From July 2018 to January 2020 costs in this industry increased 2.1 percent.
- Costs increased 7.8 percent in the five year period starting in July 2014 and ending in July 2019.
For details on which industries are included in each sector, click here
- The sector that contributes the most to this industry's demand is the Personal consumption sector. This sector accounts for 22.6% of the industry's overall demand.
- From January 2019 to January 2020, the largest change in demand for this industry was from the Real Estate and Rental and Leasing sector, where demand increased 4.2%.
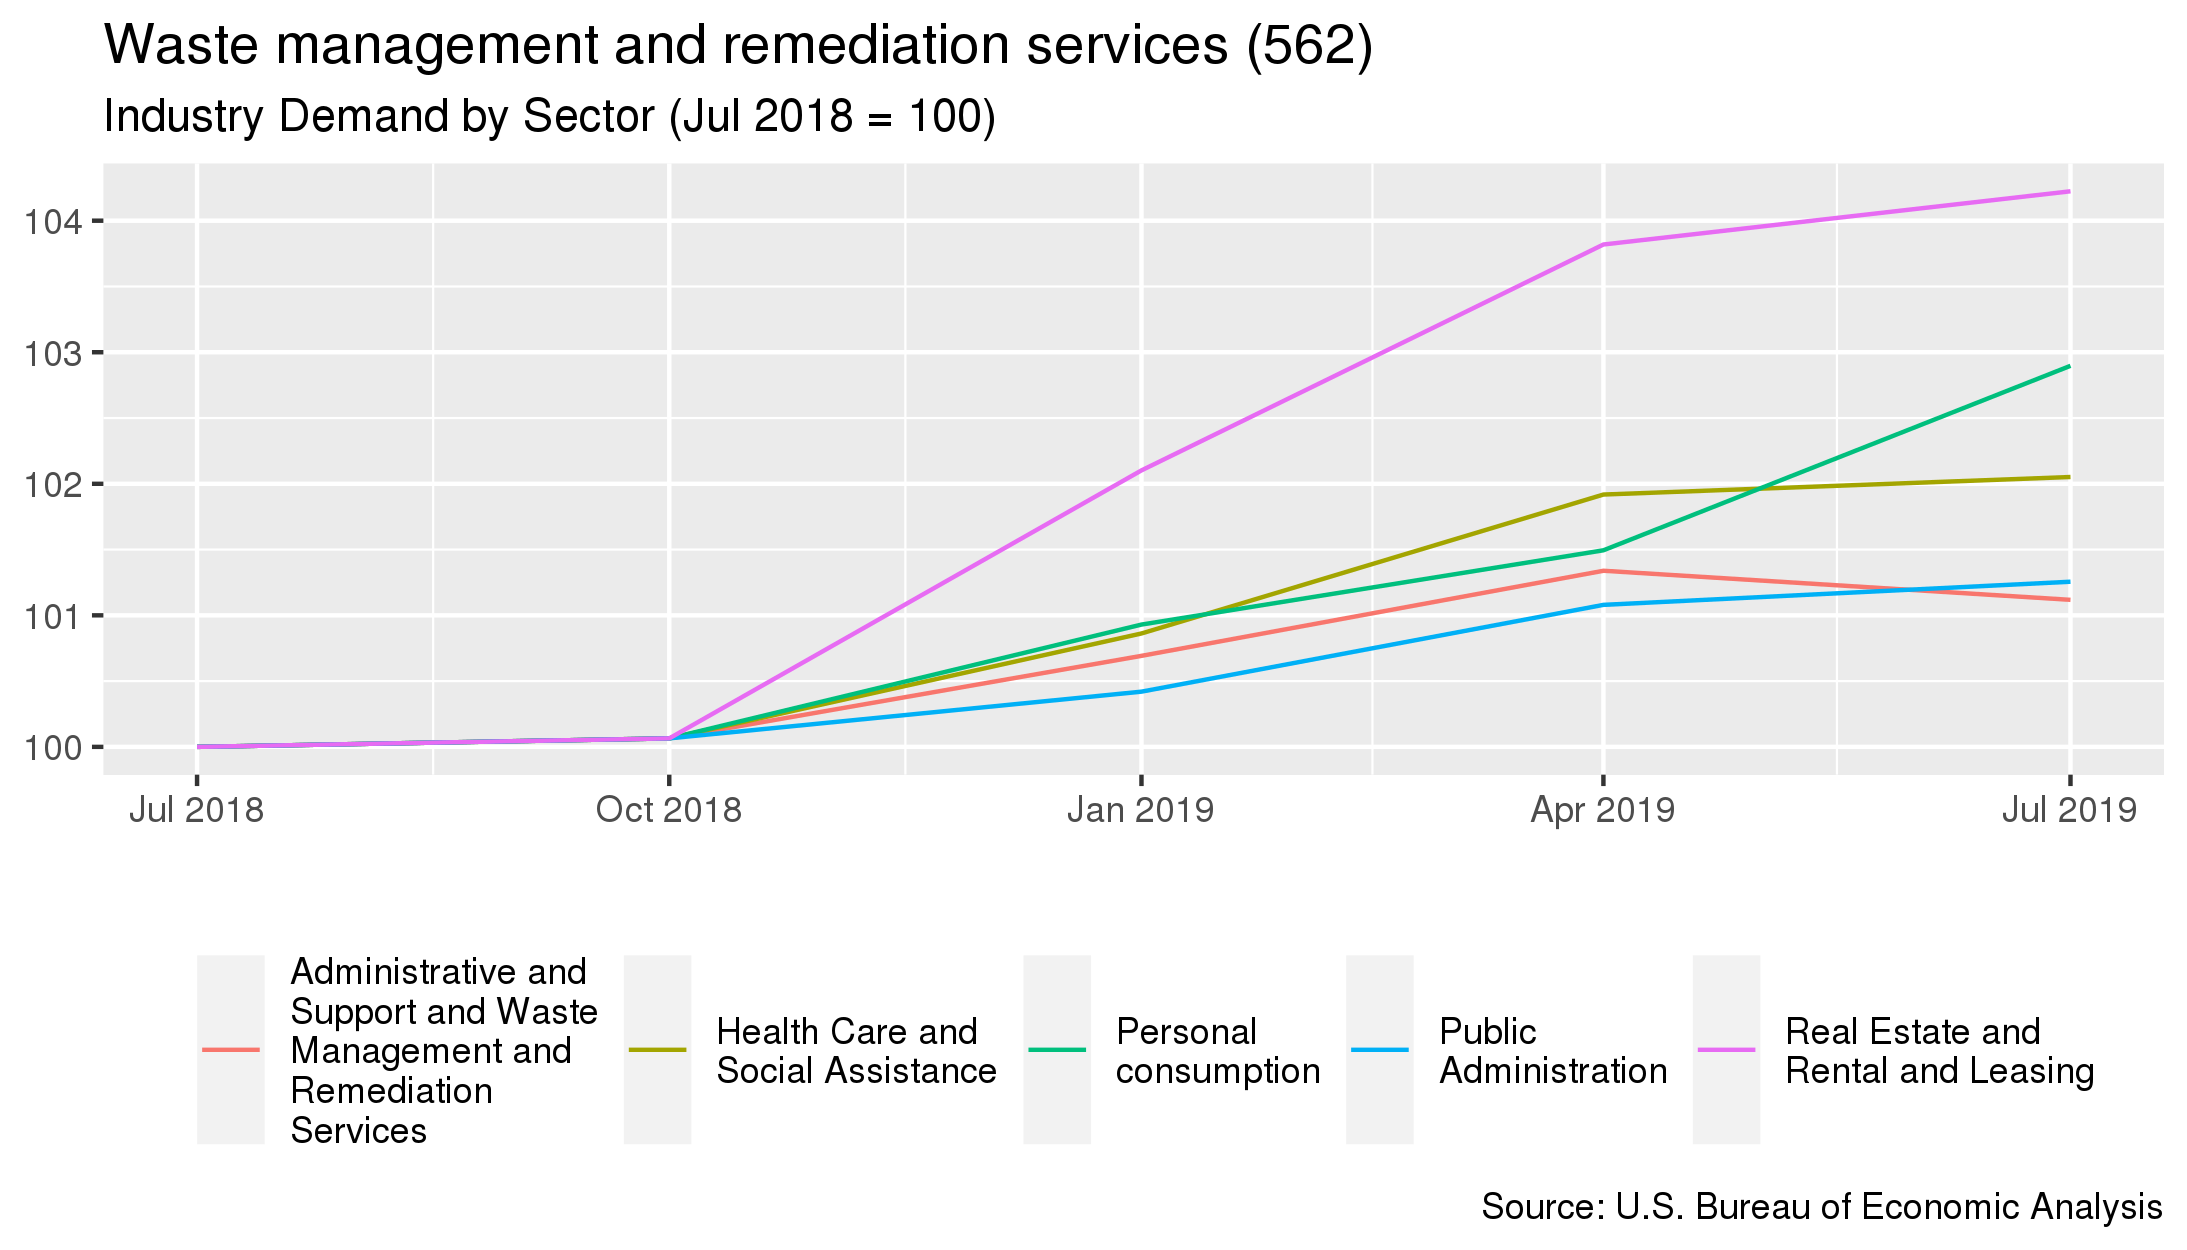
| Sector Name | Percentage of Demand | Annual Percent Change 6 |
|---|---|---|
| Personal consumption | 22.6% | +2.9% |
| Public Administration | 18.1% | +1.3% |
| Real Estate and Rental and Leasing | 12.1% | +4.2% |
| Administrative and Support and Waste Management and Remediation Services | 10.2% | +1.1% |
| Health Care and Social Assistance | 6.2% | +2.1% |
- Pricing measured from January 2020.
- The BLS PPI used for this industry is WPU50.
- Costs measured from January 2020
- Demand measured from July 2019