Amusements, gambling, and recreation industries
Industry profile, February 2020
Sections: Description | Pricing | Costs | Demand | Appendix
This page is an industry profile for the Amusements, gambling, and recreation industries industry. It provides a general economic overview of recent developments in the industry. This includes information on industry pricing, costs, and demand. Below you will find a description of what type of business establishments are included in this industry. For information on how to best utilize this industry profile please visit our Business Solutions.
Industry Description
Industries in the Amusement, Gambling, and Recreation Industries subsector (1) operate facilities where patrons can primarily engage in sports, recreation, amusement, or gambling activities and/or (2) provide other amusement and recreation services, such as supplying and servicing amusement devices in places of business operated by others; operating sports teams, clubs, or leagues engaged in playing games for recreational purposes; and guiding tours without using transportation equipment.
This industry description was sourced from the North American Industry Classification System.
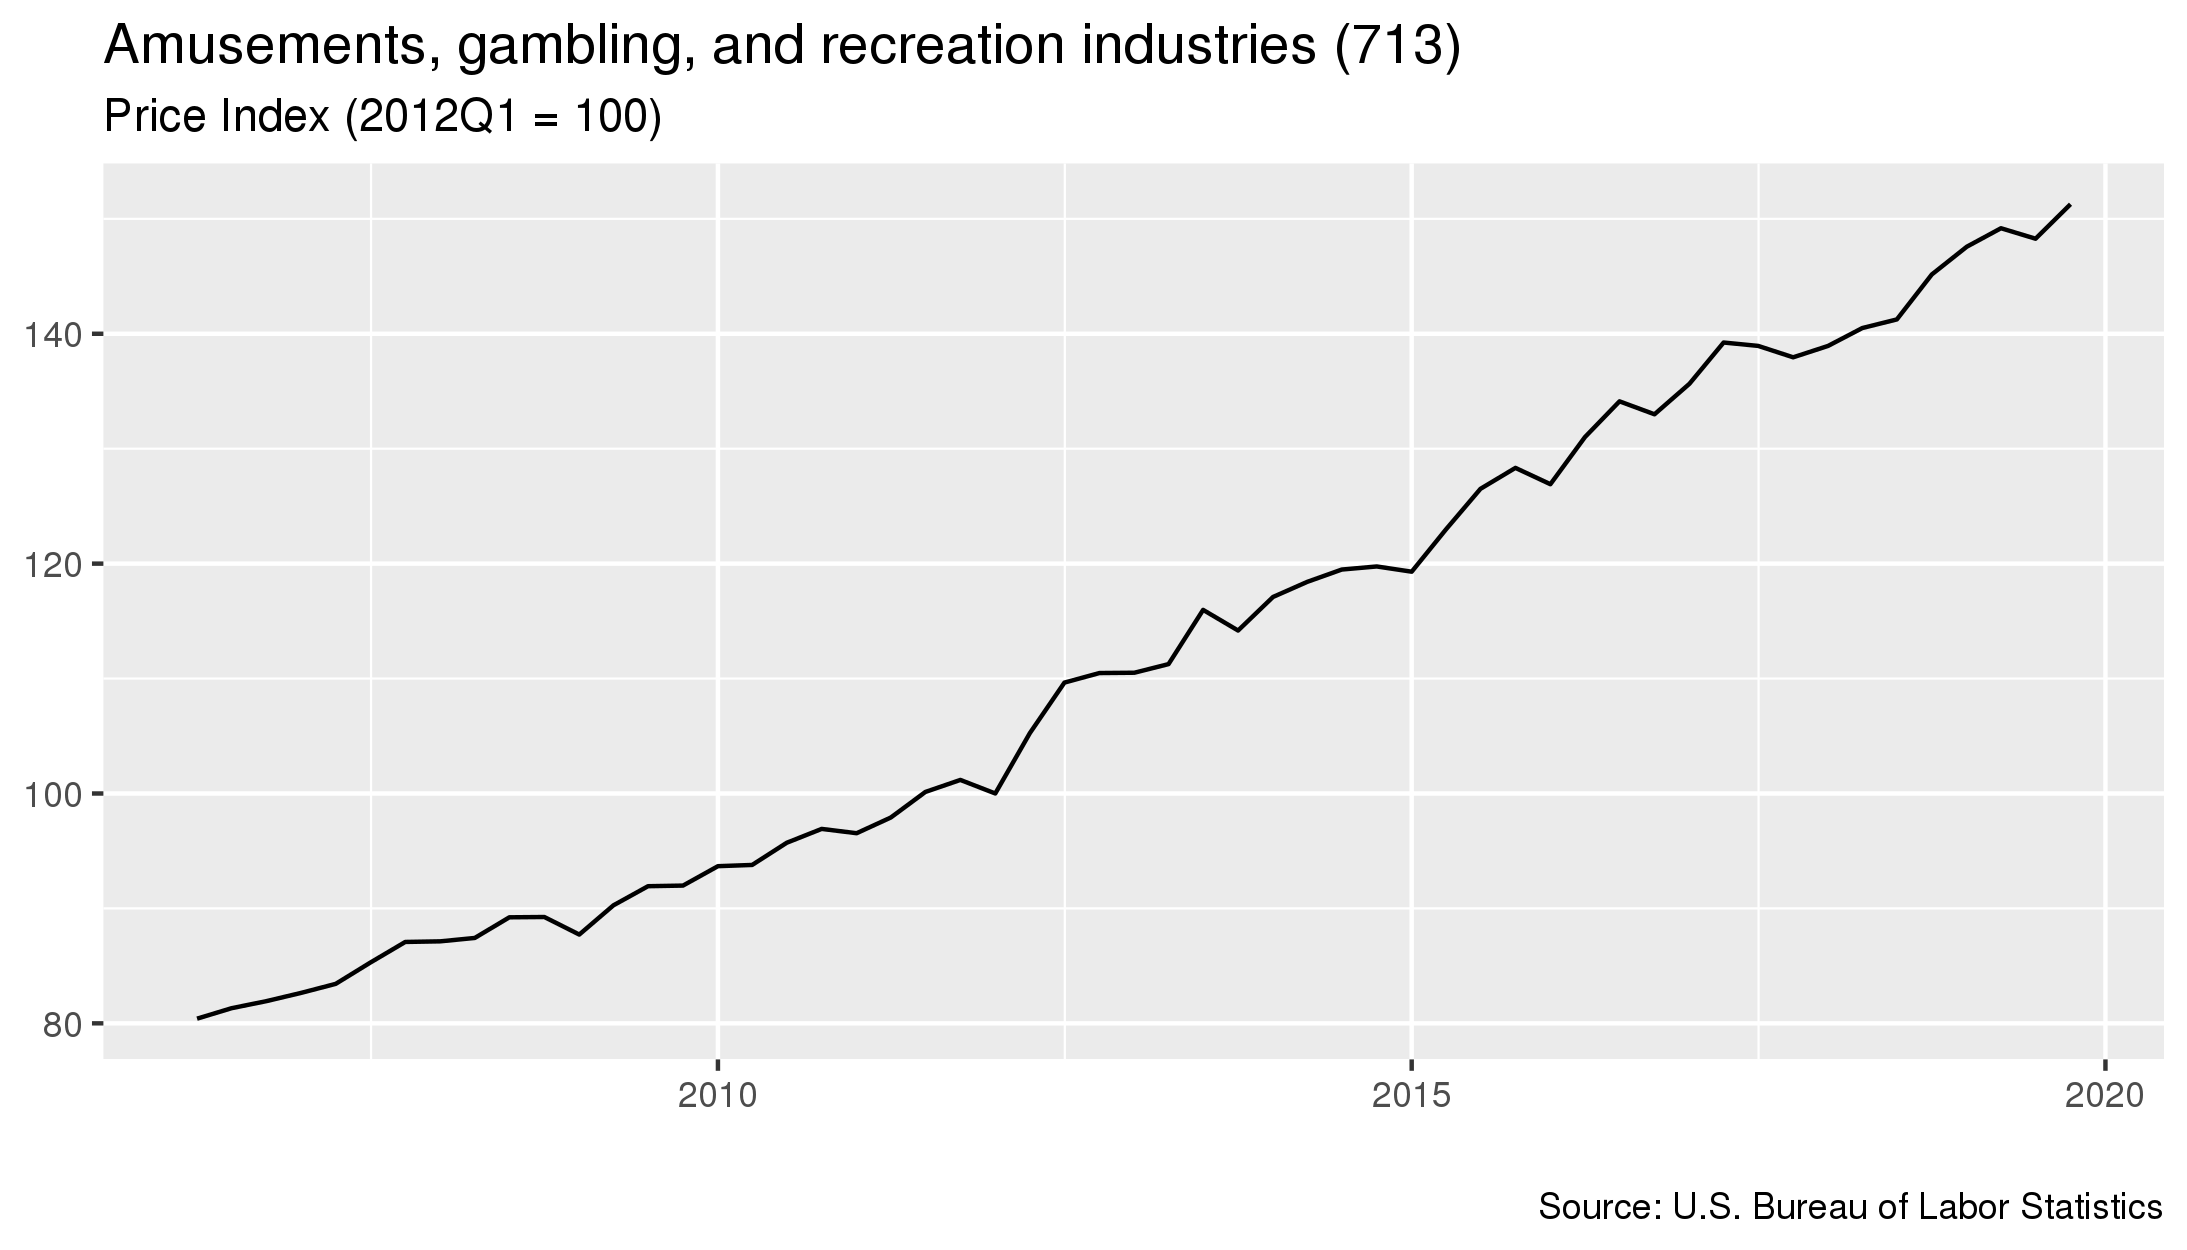
To download this data, or to learn more about how pricing is measured, please contact us.
- As of January 2020, prices in this industry had increased 2 percent since the previous quarter.
- From January 2019 to January 2020 prices in this industry increased 4.2 percent.
- Prices increased 17.9 percent in the five year period starting in January 2015 and ending in January 2020.
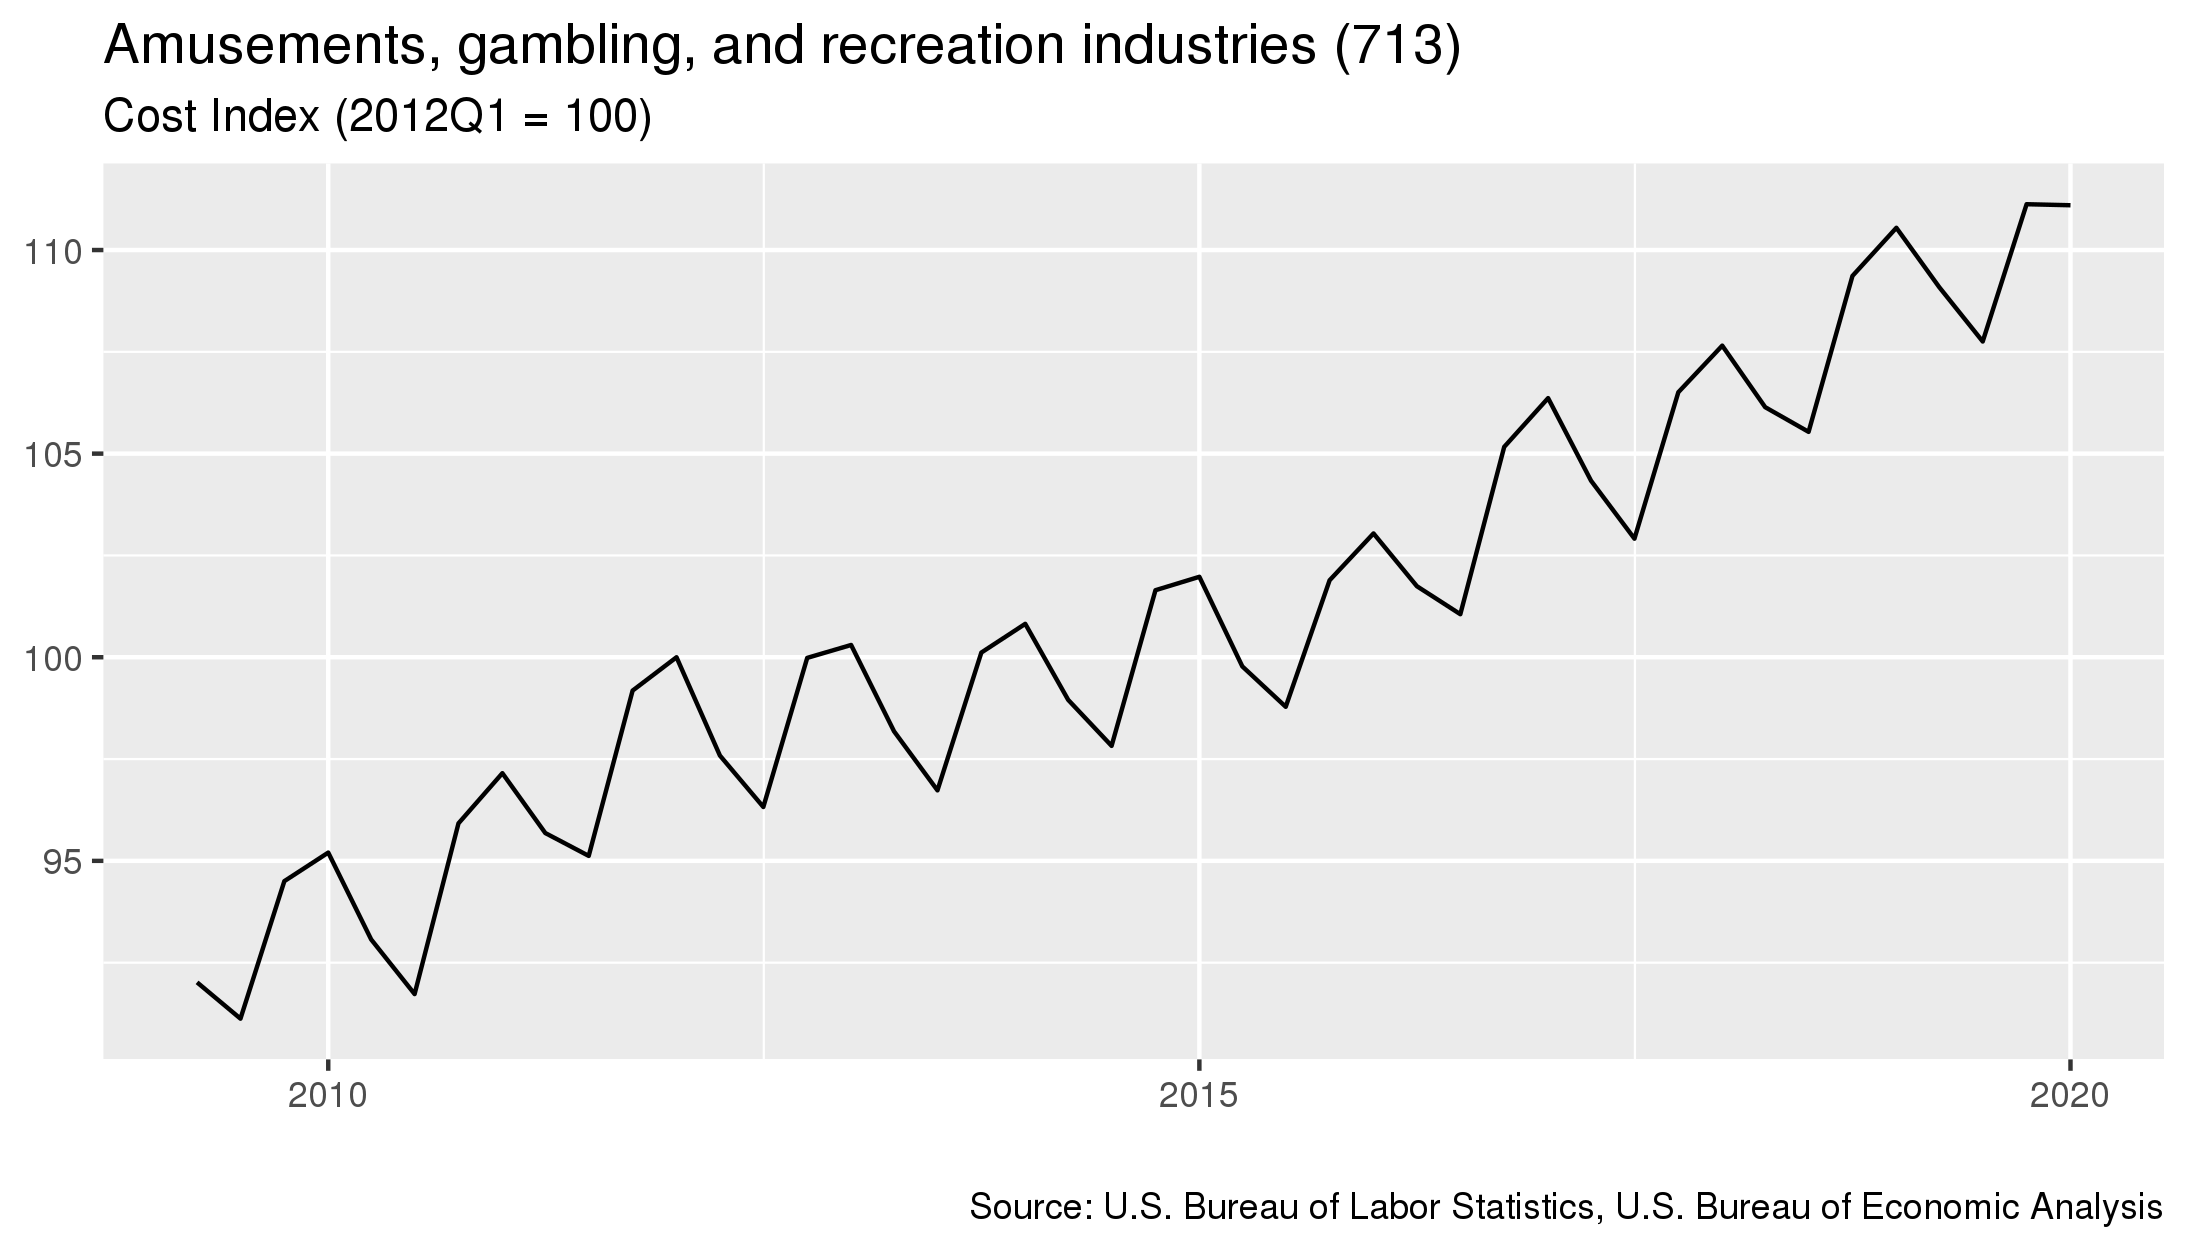
To download this data, or to learn more about how costs for this industry are measured, please contact us.
- As of January 2020, costs in this industry had 0 percent since the previous quarter.
- From January 2019 to January 2020 costs in this industry increased 0.5 percent.
- Costs increased 7.8 percent in the five year period starting in January 2015 and ending in January 2020.
For details on which industries are included in each sector, click here
- The largest cost for this industry is purchases made to the Labor sector. This sector accounts for 46.5% of the industry's overall costs.
- From January 2019 to January 2020, the largest change in costs for this industry were costs associated with purchases to the Administrative and Support and Waste Management and Remediation Services sector. Costs associated with this sector decreased -3.7%.
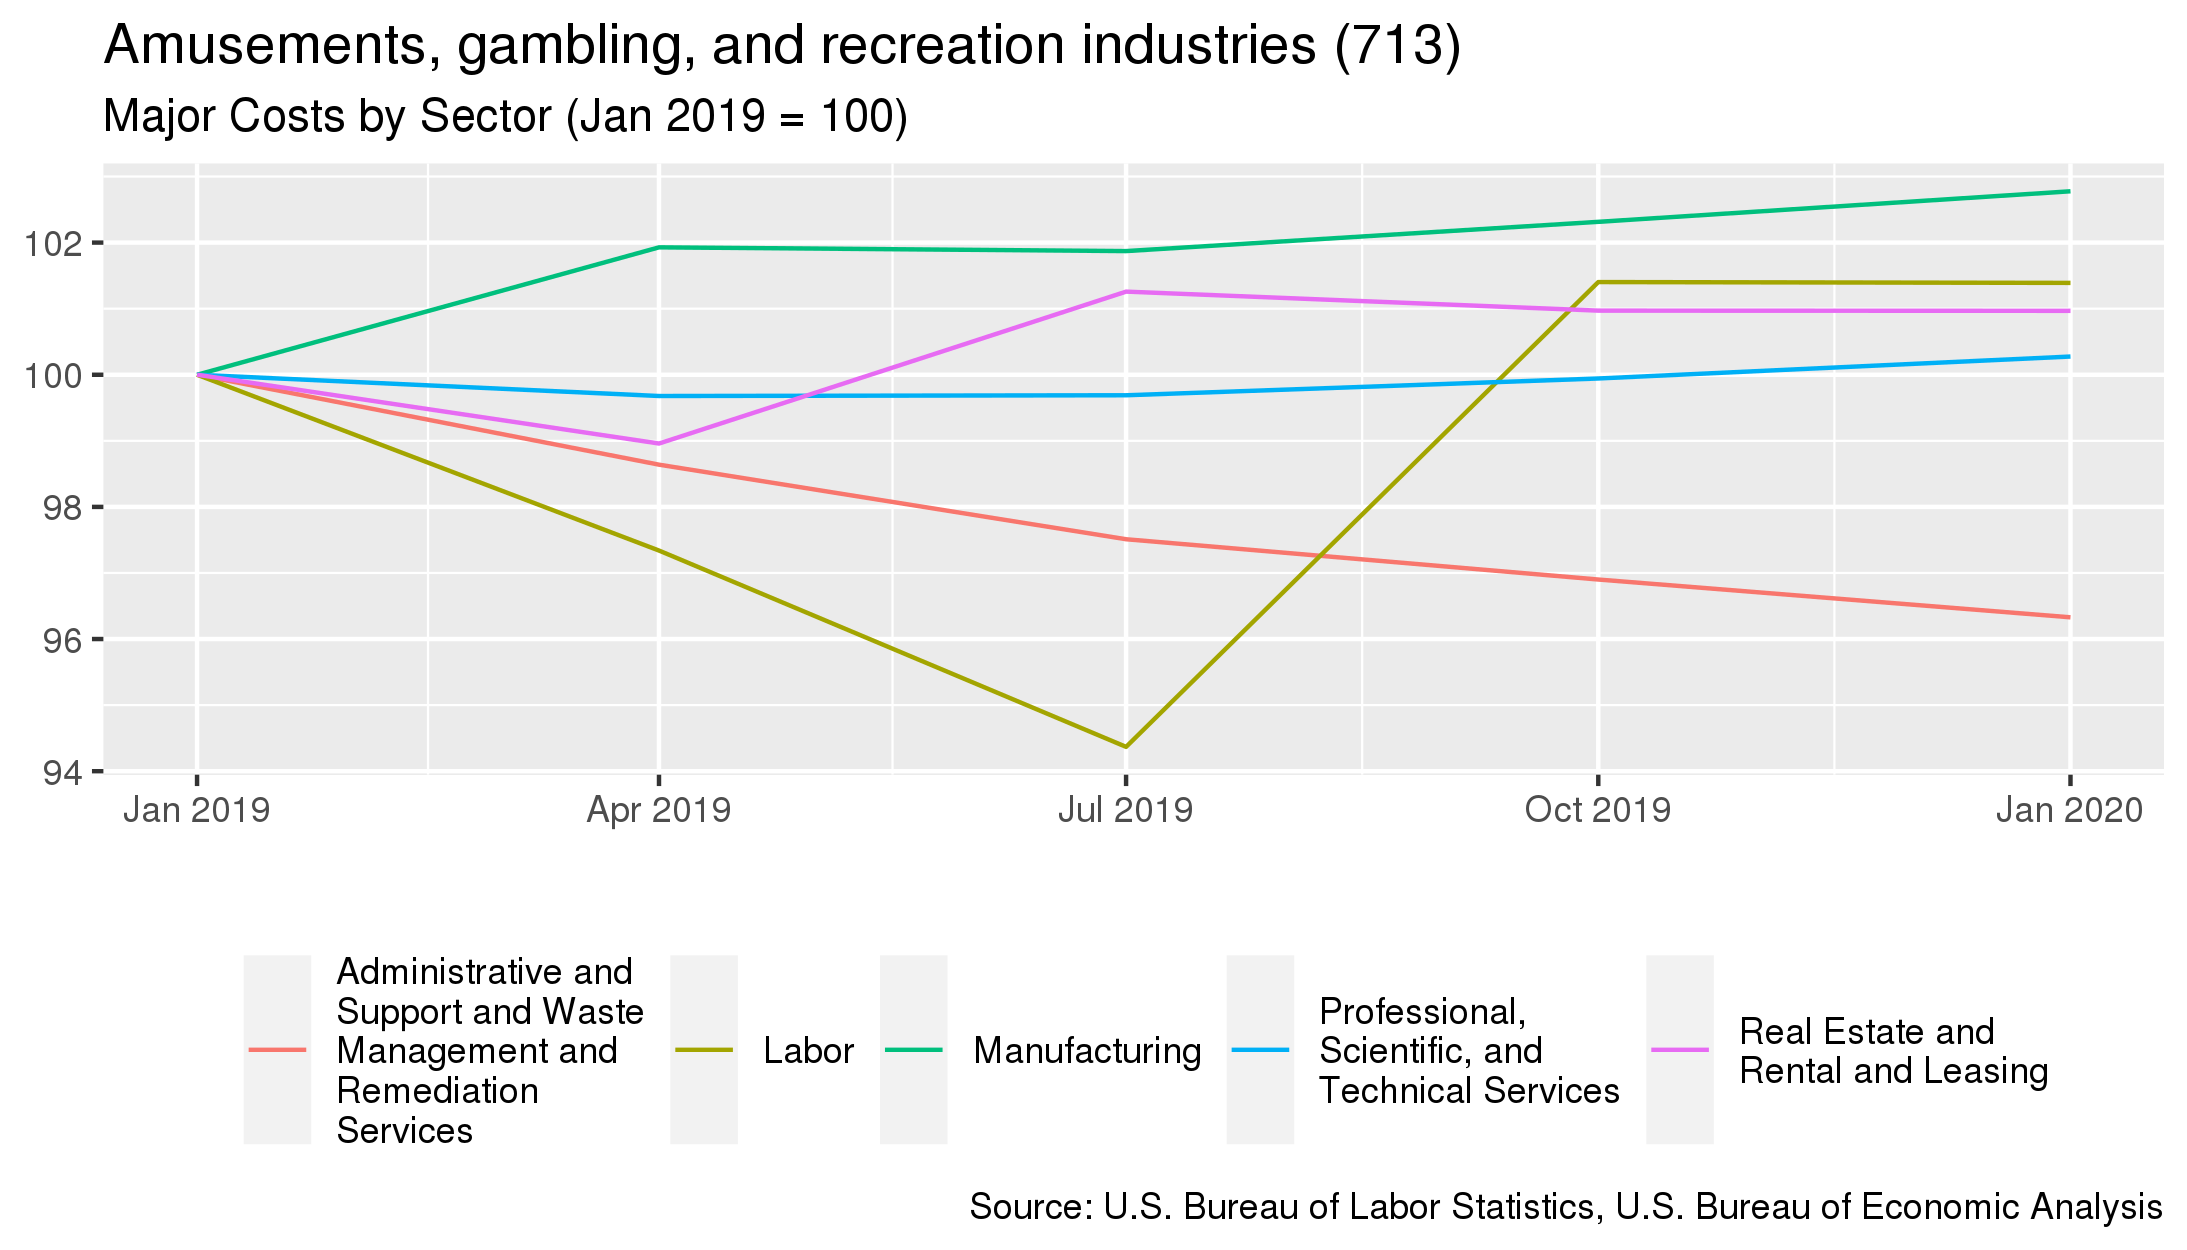
| Sector Name | Percentage of Costs | Annual Percent Change 4 |
|---|---|---|
| Labor | 46.5% | +1.4% |
| Manufacturing | 13.4% | +2.8% |
| Real Estate and Rental and Leasing | 13.2% | +1% |
| Professional, Scientific, and Technical Services | 7.9% | +0.3% |
| Administrative and Support and Waste Management and Remediation Services | 3.5% | -3.7% |
To download this data, or to learn more about how demand for this industry is measured, please contact us.
- As of July 2019, demand for this industry had increased 0 percent since the previous quarter.
- From July 2018 to January 2020 costs in this industry increased 2 percent.
- Costs increased 11.8 percent in the five year period starting in July 2014 and ending in July 2019.
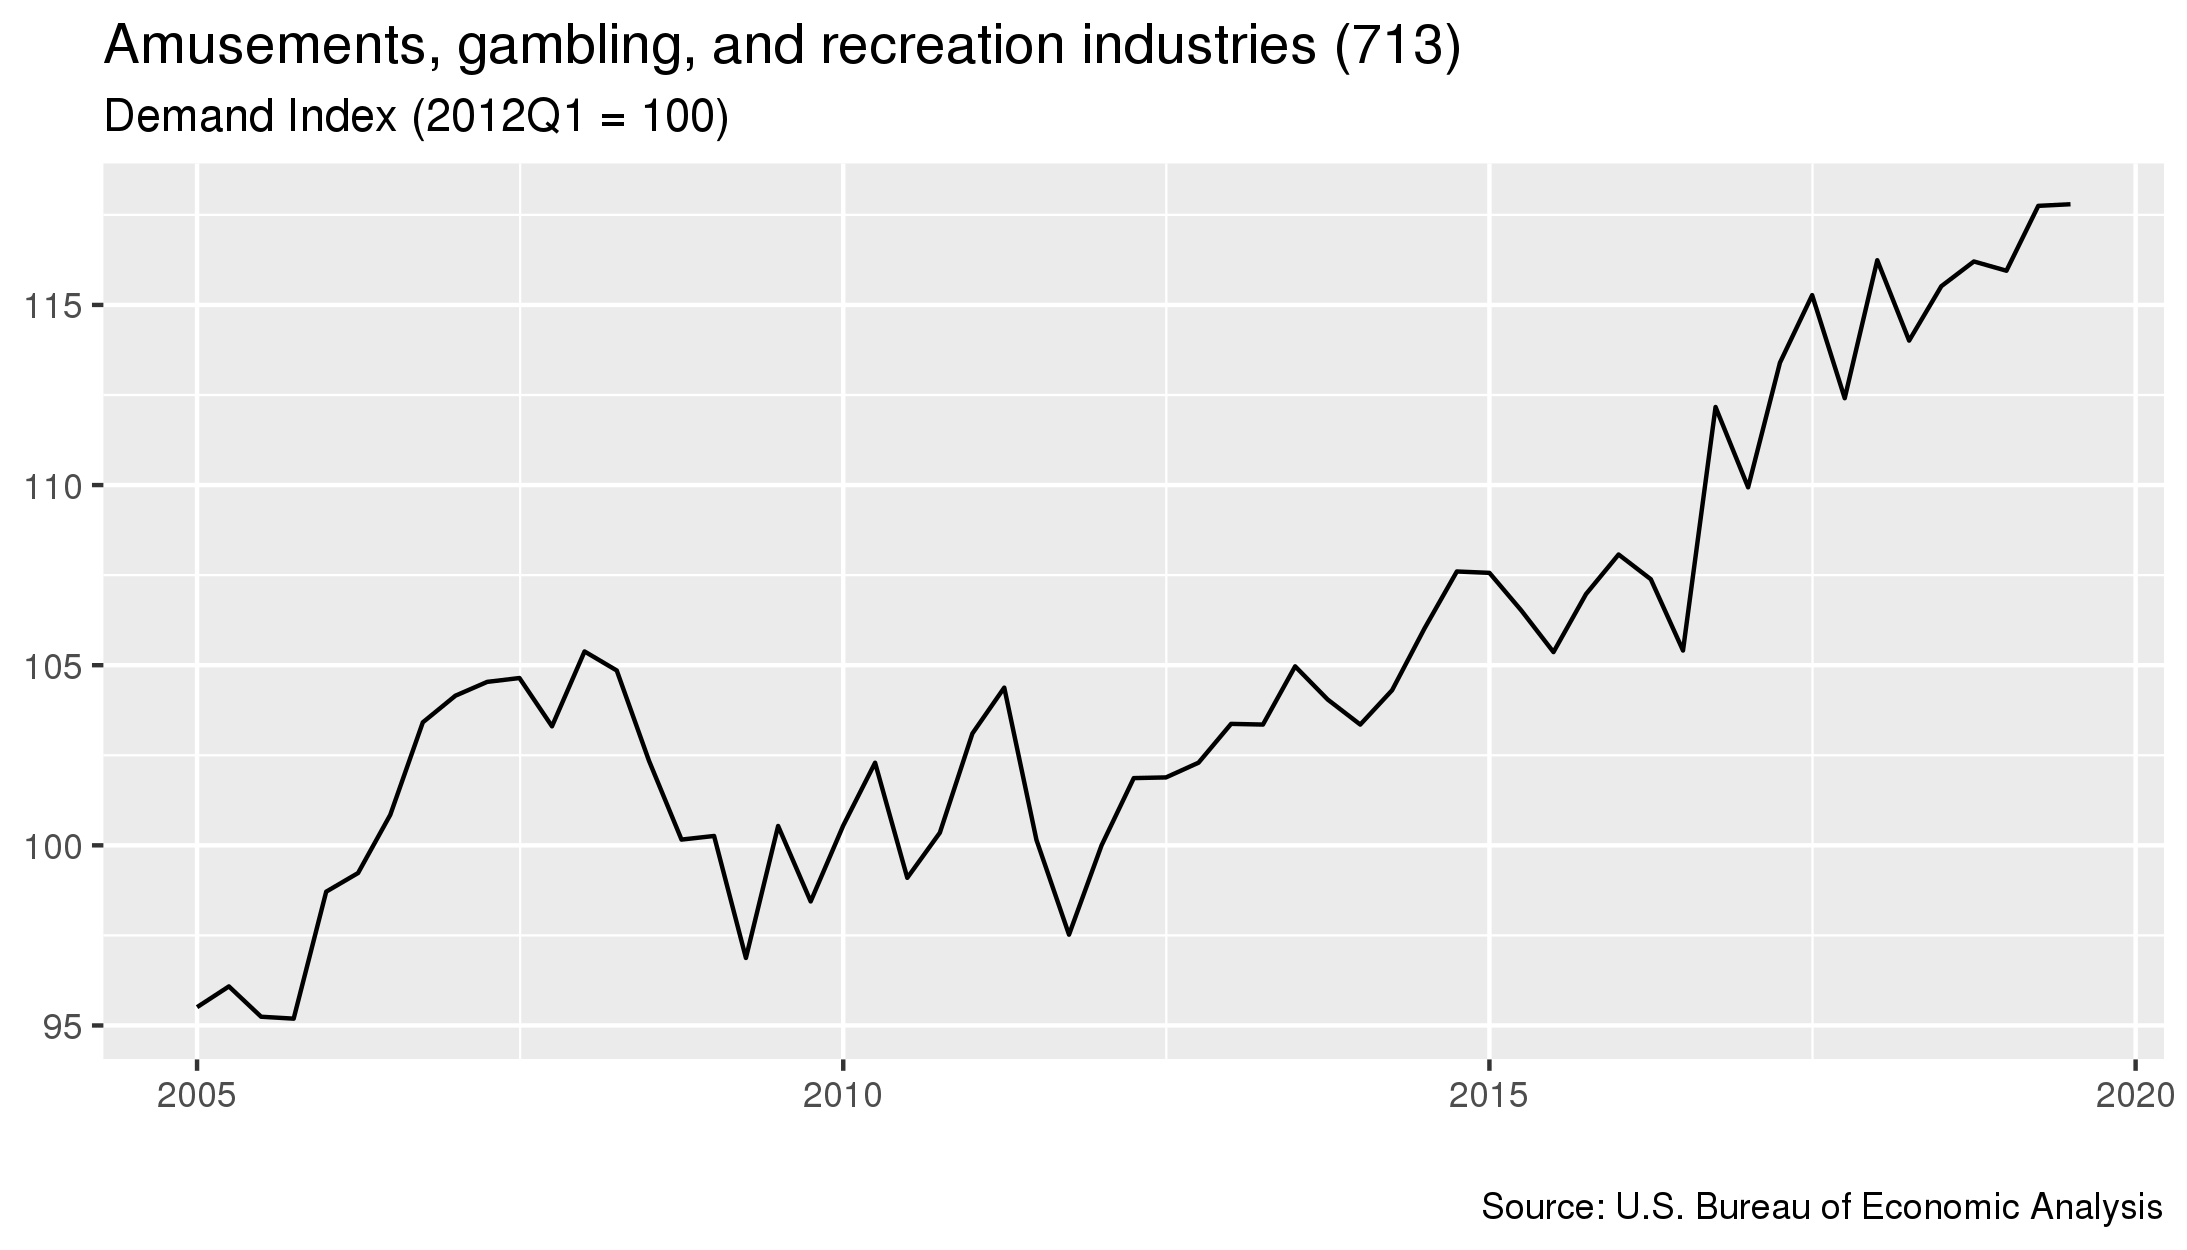
For details on which industries are included in each sector, click here
- The sector that contributes the most to this industry's demand is the Personal consumption sector. This sector accounts for 97.7% of the industry's overall demand.
- From January 2019 to January 2020, the largest change in demand for this industry was from the Management of Companies and Enterprises sector, where demand increased 7.9%.
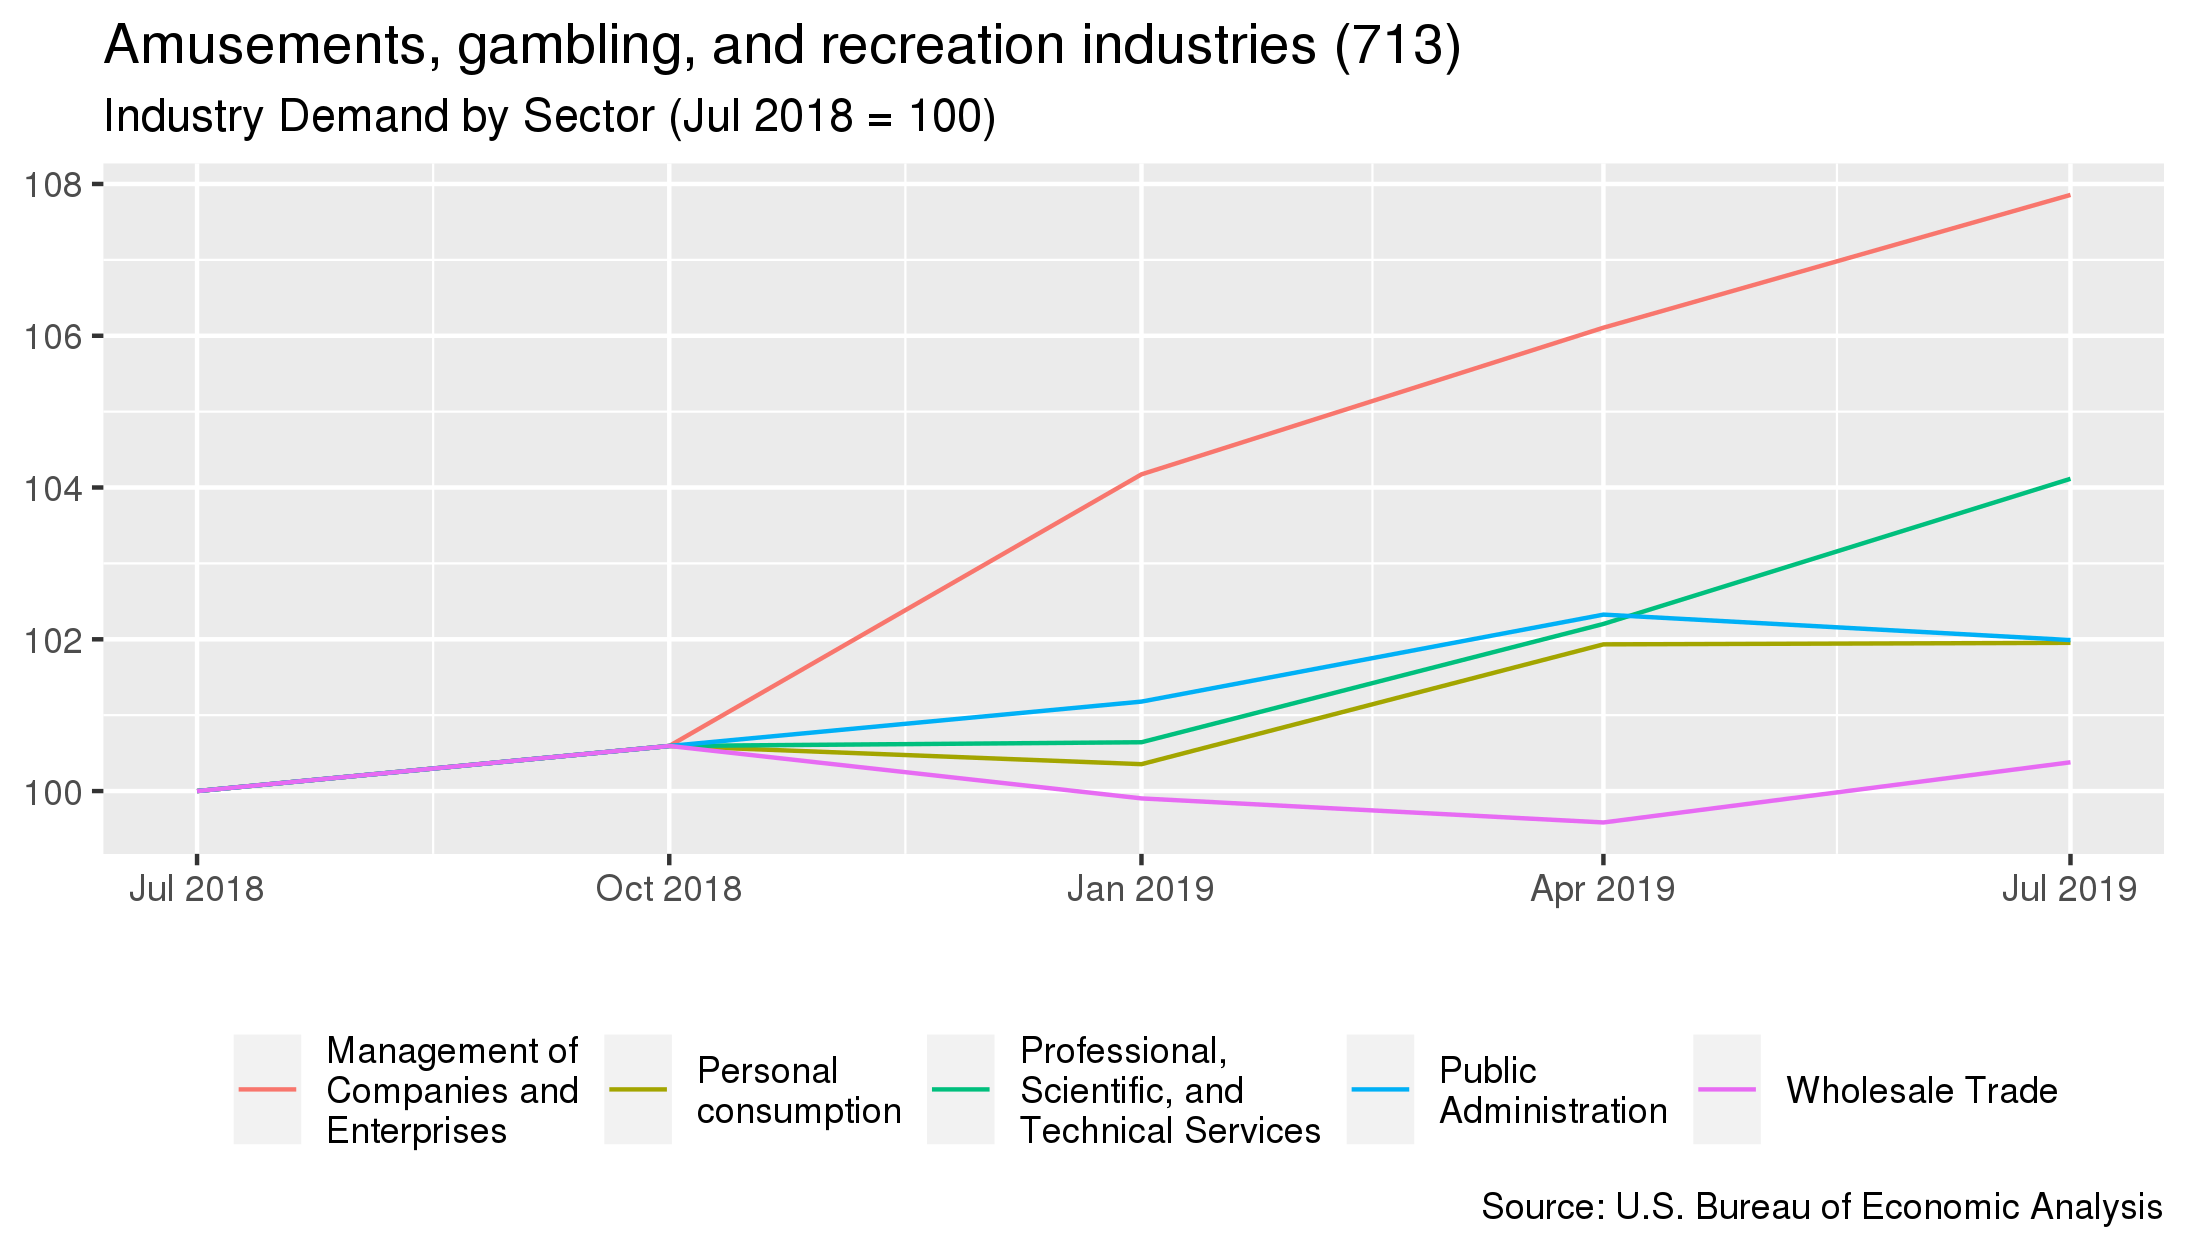
| Sector Name | Percentage of Demand | Annual Percent Change 6 |
|---|---|---|
| Personal consumption | 97.7% | +2% |
| Wholesale Trade | 0.4% | +0.4% |
| Public Administration | 0.3% | +2% |
| Professional, Scientific, and Technical Services | 0.2% | +4.1% |
| Management of Companies and Enterprises | 0.2% | +7.9% |
- Pricing measured from January 2020.
- The BLS PPI used for this industry is PCU7131--7131--.
- Costs measured from January 2020
- Demand measured from July 2019